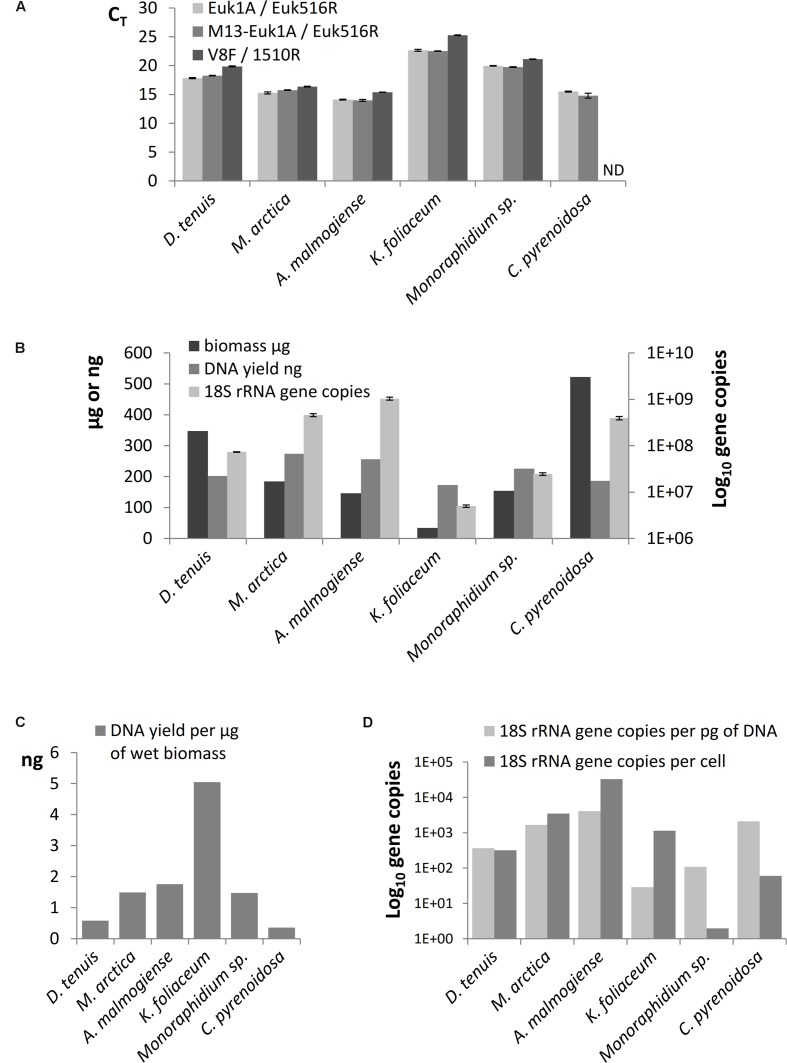
FIGURE 3.
(A) Comparison of threshold cycles (CT) of qPCR when amplification of 18S rRNA genes was performed using Euk1A/Euk516R, M13-Euk1A / Euk516R and V8F / 1510r primer pairs from equal quantity of genomic DNA (4 ng). (B) Total wet biomasses, DNA yields, and 18S rRNA gene copy numbers per Power Biofilm extraction. qPCR results are presented as mean values of triplicates with standard errors. ND indicates the sample that was not possible to amplify with the V8F/1510R primer pair. (C) DNA yields per ng of wet biomass. (D) 18S rRNA gene copy numbers per cell and per pg of extracted DNA.

