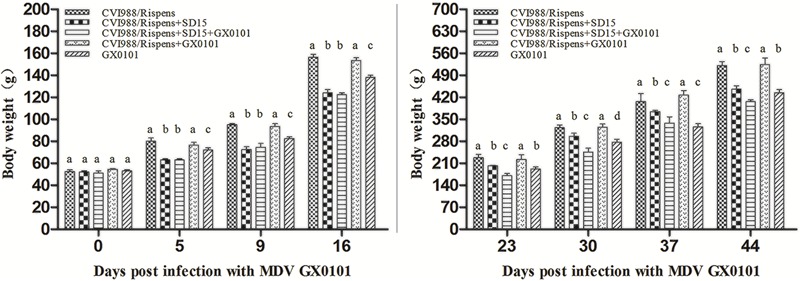
FIGURE 1.

The body weights of chickens in each group. The body weight of the chickens in different groups was measured at 0, 5, 9, 16, 23, 30, 37, and 44 days post-infection with GX0101 to evaluate the effect of virus infection on growth rates. a,b,c,dThe different letters represent significant differences (p < 0.05). The same letters indicate the differences were not significant (p > 0.05).
