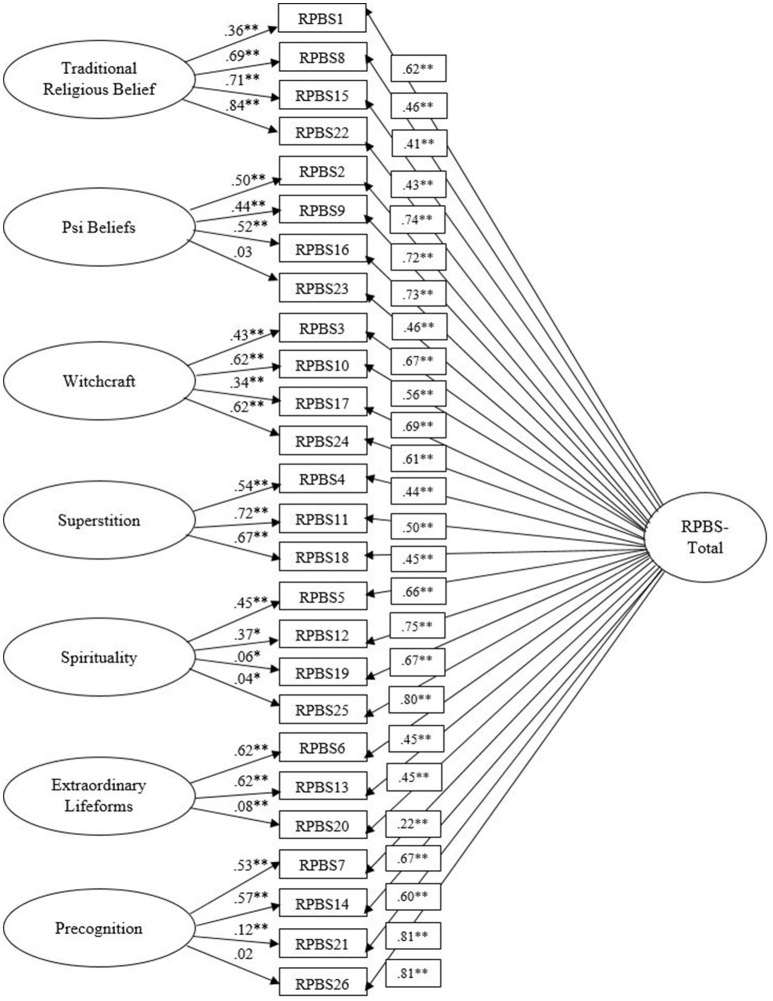
Figure 1.
Seven-factor bifactor RPBS model. Latent variables are represented by ellipses; measured variables are represented by rectangles; error is not shown, but was specified for all variables. Error covariances between RPBS1 and RPBS15, RPBS3 and RPBS17, RPBS21 and RPBS26 are not shown but were included in the analysis. *p < 0.05; **p < 0.001.

