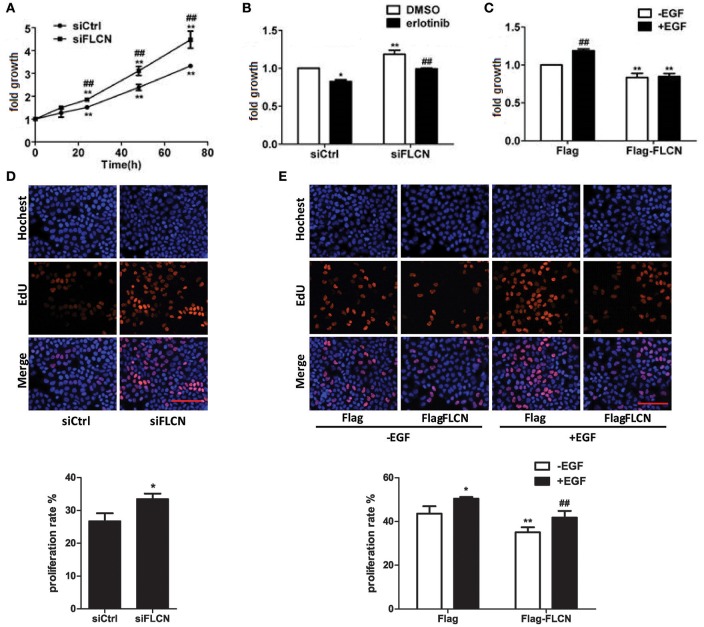
Figure 7.
FLCN involves in EGF-induced cell growth. (A) HeLa cells were transiently transfected with negative control siRNA or FLCN siRNA pool. At the indicated time points after transfection, cells were analyzed by MTT assay. *P < 0.05 and **P < 0.01 show the comparison between the different time points and the 0 h point in the same group. #P < 0.05 and ##P < 0.01 show the comparison between different groups at a same time point. (B) HeLa cells were transiently transfected with negative control siRNA or FLCN siRNA pool and treated with DMSO or 1 μM erlotinib for 72 h, then cells were analyzed by MTT assay. *P < 0.05 and **P < 0.01 show the comparison with the group transfected with negative control siRNA and treated with DMSO. ##P < 0.01 show the comparison between groups treated with DMSO and 1 μM erlotinib. (C) HeLa cells were transiently transfected with pCMV-Flag empty vector or Flag-FLCN plasmid and stimulated with 10 ng/ml EGF for 72 h, then the cells were analyzed by MTT assay. **P < 0.01 show the comparison between groups transfected with pCMV-Flag empty vector and Flag-FLCN plasmid. ##P < 0.01 show the comparison between groups with EGF stimulation and without EGF stimulation. (D) HeLa cells were transiently transfected with negative control siRNA or FLCN siRNA pool for 72 h, then cells were analyzed by EdU staining. *P < 0.05 show the comparison with the group transfected with negative control siRNA and FLCN siRNA. Scale bar, 100 μm. (E) HeLa cells were transiently transfected with pCMV-Flag empty vector or Flag-FLCN plasmid and stimulated with 10 ng/ml EGF for 72 h, then the cells were analyzed by EdU staining. *P < 0.05, **P < 0.01 show the comparison with group transfected with pCMV-Flag empty vector with other groups. ##P < 0.01 show the comparison between EGF-incubation groups transfected with pCMV-Flag empty vector and Flag-FLCN plasmid. Scale bar, 100 μm.

