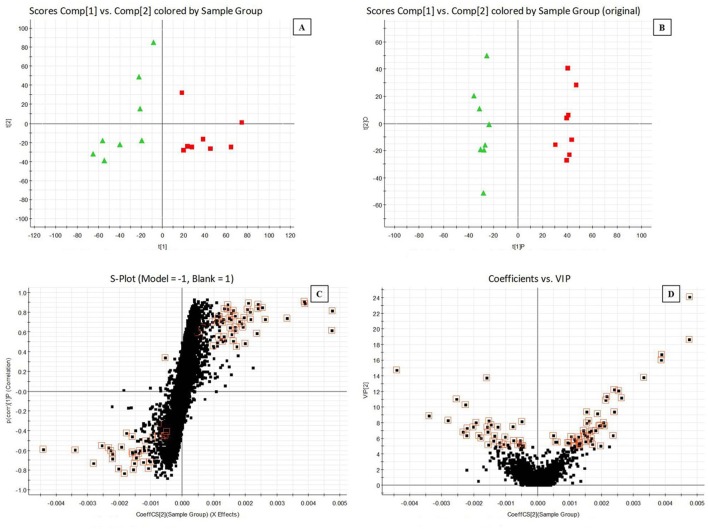
Figure 2.
Principal components analysis (PCA) scores plots for urine samples of (A) normal group (red  ) vs. model group (green
  ) and orthogonal partial least-squared discriminant analysis (OPLS-DA) scores plots of (B) normal group (red
  ) vs. model group (green
  ). (C) S-plot of OPLS-DA and (D) VIP-plot of OPLS-DA in negative mode.

