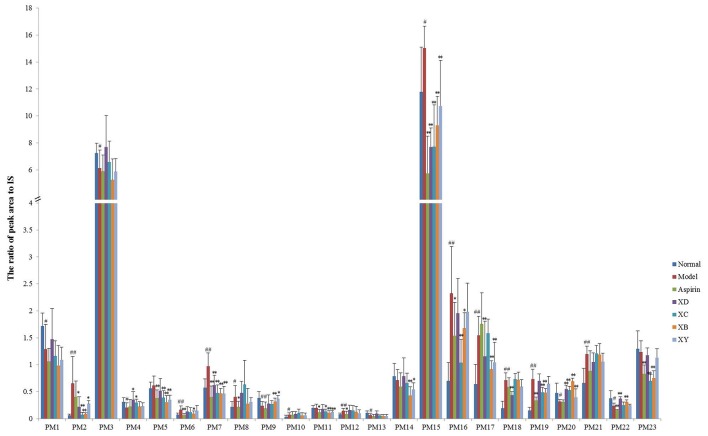
Figure 3.
Changes in the relative peak area (vs. IS) of target metabolites identified in plasma and urine (mean ± SD, n = 8). #p < 0.05, ##p < 0.01 compared to the normal group. *p < 0.05, **p < 0.01 compared to the model group. PM1, lysoPE(22:4/0:0); PM2, trihydroxycholan-24-oic acid; PM3, lysoPC(17:0); PM4, lysoPE(20:2/0:0); PM5, lysoPE(24:6/0:0); PM6, taurodeoxycholic acid; PM7, arachidonic acid; PM8, tauroursocholic acid; PM9, lysoPE(22:1/0:0); PM10, chimonanthine; PM11, PG(10:0/10:0); PM12, cofaryloside; PM13, PC(19:3/0:0); PM14, lysoPE(0:0/18:0); PM15, indoxylsulfuric acid; PM16, estrone 3-glucuronide; PM17, 5-(4-acetoxybut-1-ynyl)-2,2′-bithiophene; PM18, polyethylene oxidized; PM19, succinoadenosine; PM20, 17-hydroxypregnenolone sulfate; PM21, uralenneoside; PM22, 2,8-dihydroxyquinoline-beta-D-glucuronide; PM23, dihydrocaffeic acid 3-sulfate.

