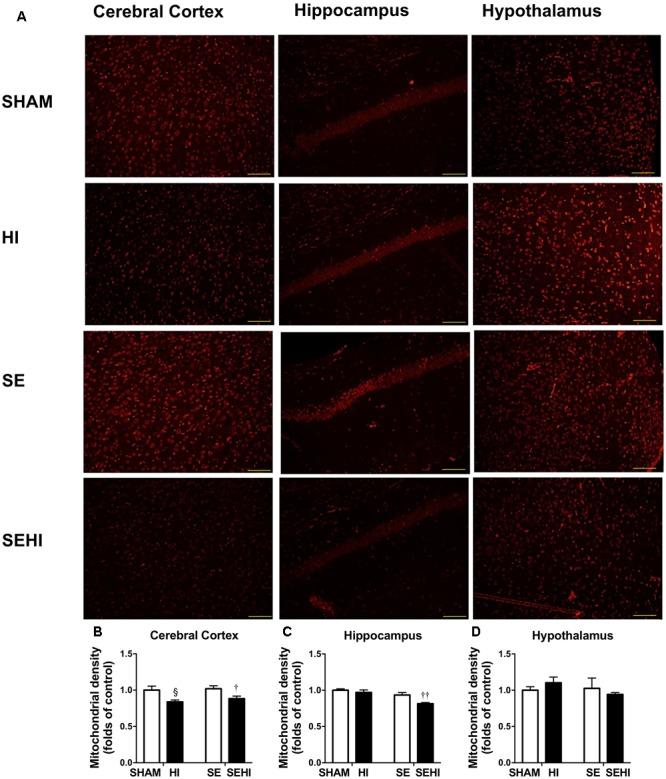
FIGURE 6.

Mitochondrial density in the cerebral cortex, hippocampus, and hypothalamus in the male offspring at P45 (n = 5) (A–D). Results are expressed as mean ± SEM. By t-test, § P < 0.05, HI vs SHAM; ††P < 0.01; †P < 0.05, SEHI vs SE. Scale bar = 40 μm. HI, hypoxic-ischemic injury; SE, maternal smoke exposure; SEHI, maternal smoke exposure with hypoxic-ischemic injury.
