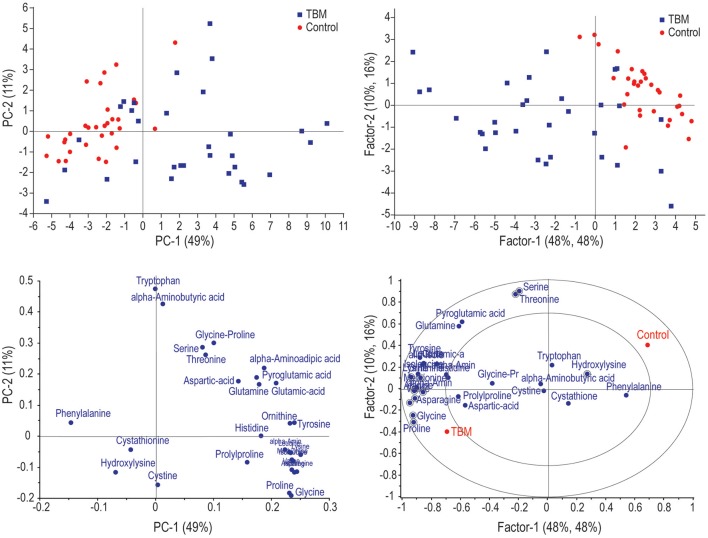
Figure 1.
(Left) principal component analysis (PCA) scores plot (top) and corresponding loadings (bottom) of the various amino acids identified in the TBM and control cases. (Right) Partial least squares discriminant analysis (PLS-DA) scores plot (top) with corresponding loadings (bottom) indicating important discriminatory (circled) variables.

