
Figure 2.
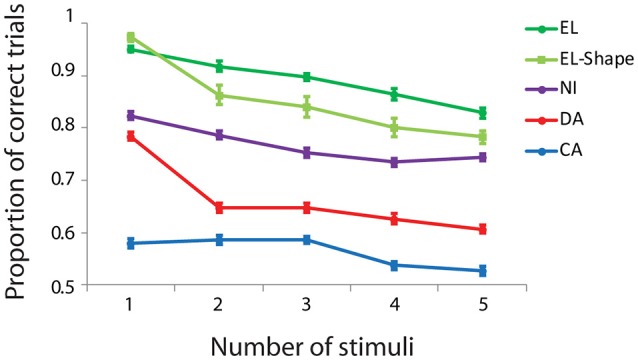
Behavioral performance in the working memory capacity task as a function of number of stimuli. Proportion of correct trials is plotted for four different subjects (EL, NI, DA, and CA) in the spatial task, and one subject (EL) in the shape task. Error bars represent mean ± SEM across daily sessions.