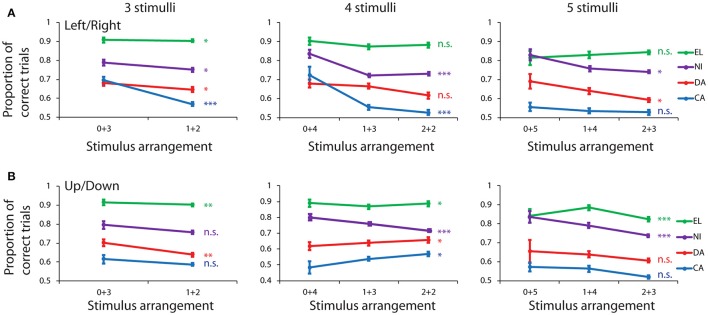
Figure 3.
Behavioral performance in the spatial Match/Nonmatch task for different stimulus groups. (A) Proportion of trials that ended in a correct response is shown for different numbers of stimuli appearing in the left and right hemifield. Data from four subjects are shown in different colors: EL, NI, DA, and CA. (B) Stimulus groups were sorted between up and down hemifields. Error bars represent mean ± SEM. *p < 0.05, **p < 0.01, ***p < 0.001, n.s., not significant.

