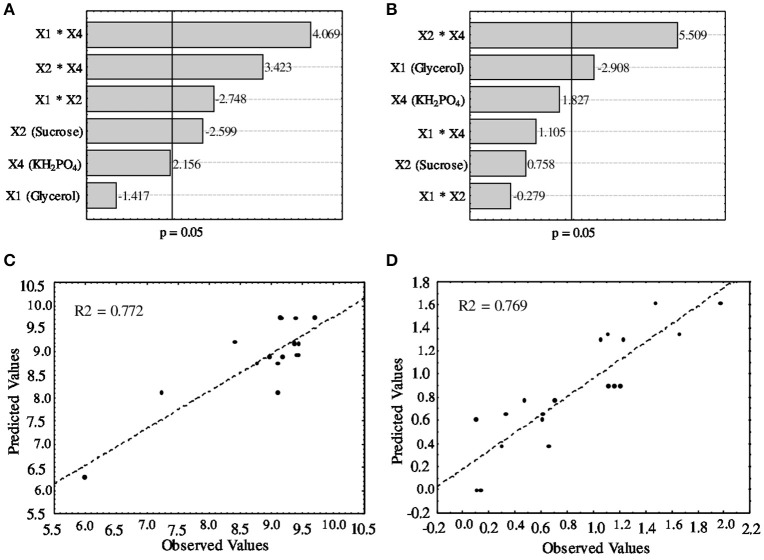
Figure 1.
Pareto chart of standardized linear and combined effects estimated from different variables (A,B) and parity plots of experimental vs. predicted values (C,D) according to the mathematical models developed for A. brasilense Ab-V5. (A) Pareto chart of estimated effects on biomass productivity; (B) Pareto chart of estimated effects on EPS production; (C) parity plot of biomass productivity; (D) parity plot of EPS production. X1 glycerol, X2 sucrose and X4 K2HPO4. The line in (A,B) indicates the point at which the effect estimates become statistically significant (p > 0.05).

