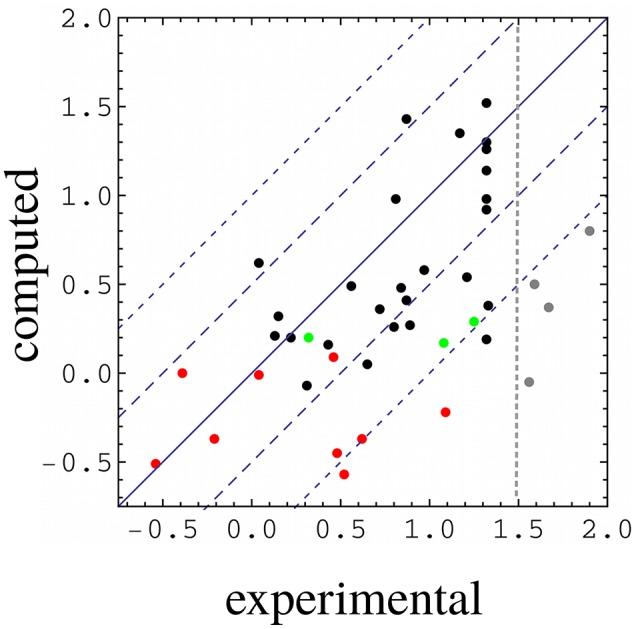
Figure 3.

Computed vs. experimental relative binding free energies (kcal/mol). WT:Sdc1 is the reference system. Red, complexes involving Caspr4; green, complexes involving Neurexin; gray, complexes with very weak binding (not included in parameter fitting); black, all other complexes. The vertical line separates the weakest binders from the others. All but the weak binders (gray) and the three Neurexin complexes (green) were used for model fitting.
