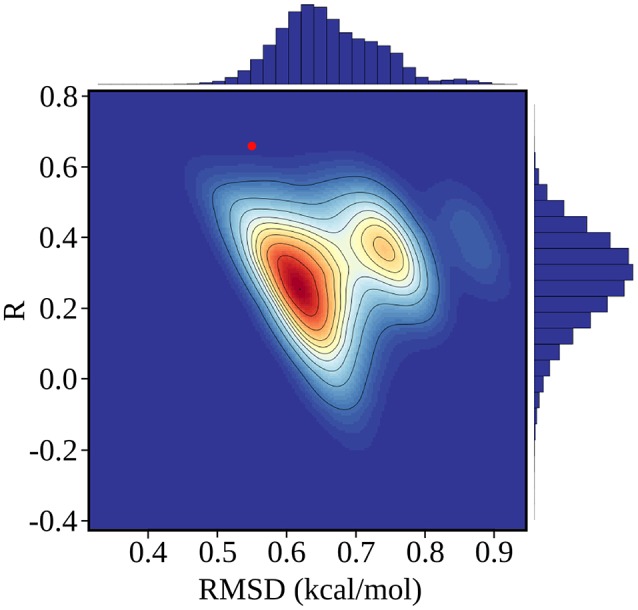
Figure 4.

Error statistics for 100,000 random, Scrambled models obtained by fitting scambled experimental data. The number density of models in each region of the plot is color coded from red (high) to blue (low), and contour lines delimit regions that each contain 10% of the models. The PB/LIE model is shown as a red dot; only 63 scrambled models (0.06%) have better R and rmsd values. Histograms of R and rmsd values for the scrambled models are shown along the upper and right edges of the plot.
