Fig. 4.

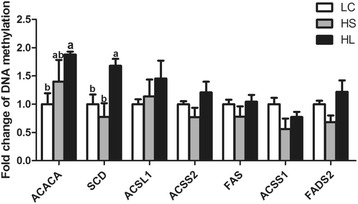
The level of the DNA Methylation in the promoter regions of the target genes. Data are presented as mean ± SE. Mean values without common superscript (a, b) differ significantly among LC, HS and HL groups (P < 0.05)

The level of the DNA Methylation in the promoter regions of the target genes. Data are presented as mean ± SE. Mean values without common superscript (a, b) differ significantly among LC, HS and HL groups (P < 0.05)