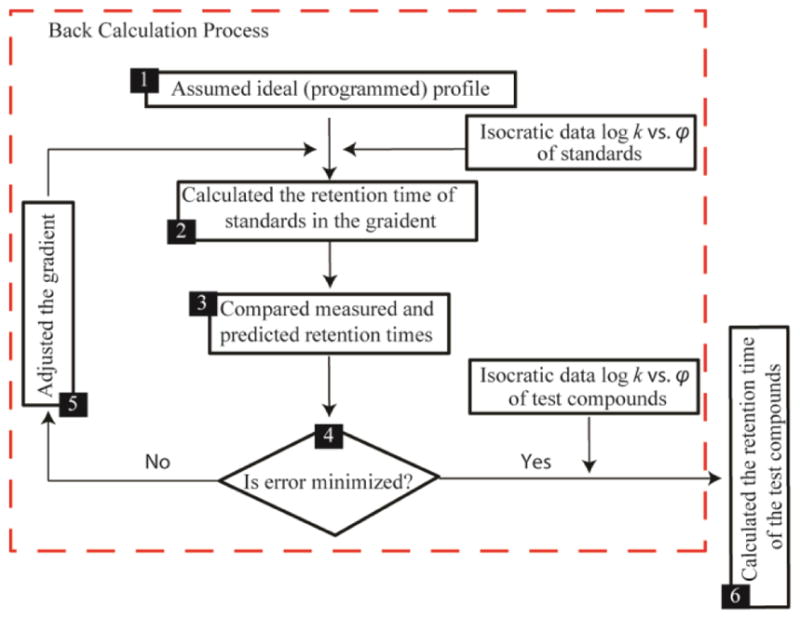
Figure 2.

Flow chart of the retention projection methodology with back-calculation. Retention projection starts by assuming the gradient produced the LC instrument is ideal. Then the gradient is adjusted iteratively until the difference between the projected retention times and their experimental retention times are minimized. This back-calculated gradient is then used to project the retention times of other compounds with known k vs. φ relationships.
