Figure 1.
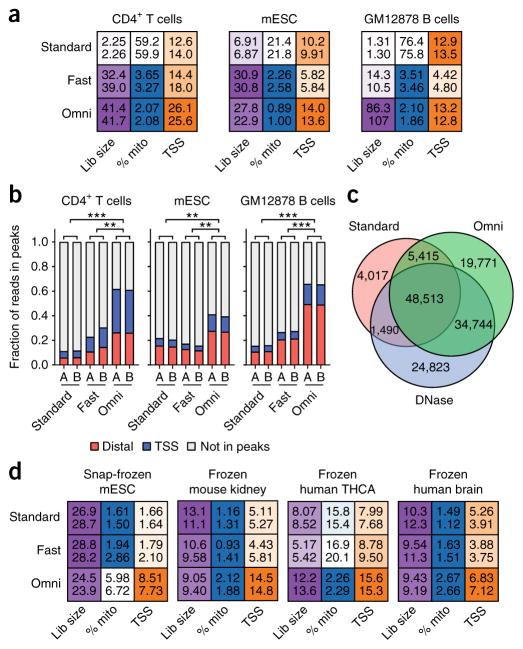
Comparison of the Omni-ATAC protocol to standard ATAC-seq or Fast-ATAC. (a) Heat-map-based representation of ATAC-seq quality control metrics, including estimated library size (“Lib size”; purple), percentage of reads mapping to mitochondrial DNA (“% mito”; blue), and enrichment of signal at TSSs (orange) (Online Methods). Deeper color is used to depict the most desirable value of each statistic and ranges following a linear scale starting at 0 (white) and ending at the maximum value for the given cell type. In the case of the percentage of reads that map to mitochondrial DNA (% mito), the color scale starts at the maximum value (white) and ends at 5% (blue). All values were determined from 5 million random aligned reads. Two technical replicates are shown per sample as numeric values within each box. (b) Fraction of reads in peaks that map to TSSs (±500 bp of TSS) and distal elements (>500 bp from TSS) from libraries generated in this study, using the standard ATAC-seq method (“Standard”), the Fast-ATAC-seq method (“Fast”), or the Omni-ATAC protocol (“Omni”). Each bar represents a single technical replicate. **P < 0.01; ***P < 0.001 by two-tailed unpaired Student’s t-test comparing the fraction of reads in peaks to reads outside of peaks. All values were determined from 5 million random aligned de-duplicated reads. mESC, mouse embryonic stem cell. (c) Overlap of GM12878 peaks called from 60 million reads using standard ATAC-seq, DNase-seq, and Omni-ATAC. All input reads were trimmed to equal lengths (36 bp) before alignment. Data represent the mean of three individual downsampling replicates. (d) Heat-map-based representation of ATAC-seq quality control metrics, including estimated library size, percentage of reads mapping to mitochondrial DNA, and enrichment of signal at TSSs, as shown in a. Deeper color is used to depict the most desirable value of each statistic. All values were determined from 5 million random aligned reads. Two technical replicates are shown per sample.

