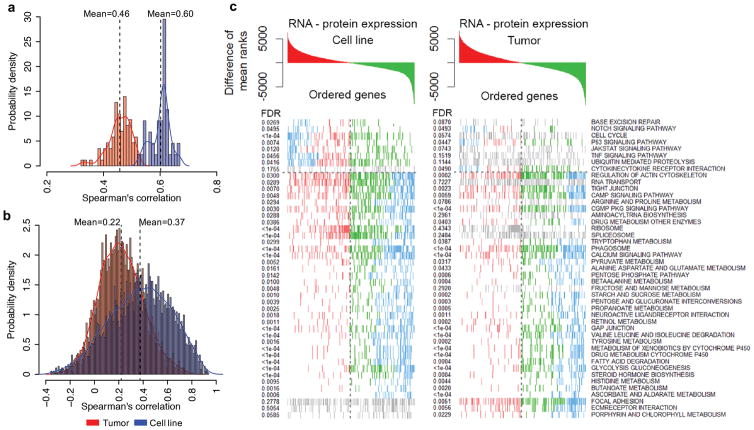
Figure 3. Comparison of the correlations between mRNA and protein abundance in tumor and cell line data.
(a) Correlations between steady state mRNA and protein abundance across genes within individual samples. (b) Correlations between mRNA and protein variation across cell line or tumor samples for each gene. (c) GSEA KEGG enrichment for average differences in mRNA-protein ranks across genes in both the cell line and tumor data. Genes colored in red are ranked higher in RNA, genes in green ranked higher in proteomics and blue are the leading-edge GSEA genes.

