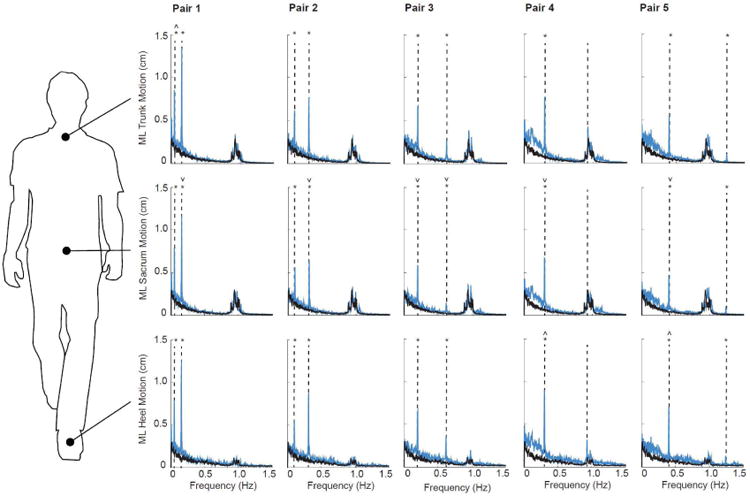
Fig. 2.

Group average spectrum of trunk, sacrum, and heel mediolateral motion for visually perturbed walking (Pairs 1-5, blue lines) compared to normal, unperturbed walking (black lines). Vertical dashed lines indicate the driving frequencies included in each visual perturbation: Pair 1 (0.05 and 0.155 Hz), Pair 2 (0.10 and 0.31 Hz), Pair 3 (0.20 and 0.62 Hz), Pair 4 (0.30 and 0.93 Hz), and Pair 5 (0.40 and 1.24 Hz). Asterisks (*) indicate significant difference between normal and visually perturbed walking at a given driving frequency (p<0.05). Carets (˄) and inverse Carets (˅) indicate significantly larger and smaller responses compared to both other anatomical positions at a given driving frequency, respectively (p<0.05).
