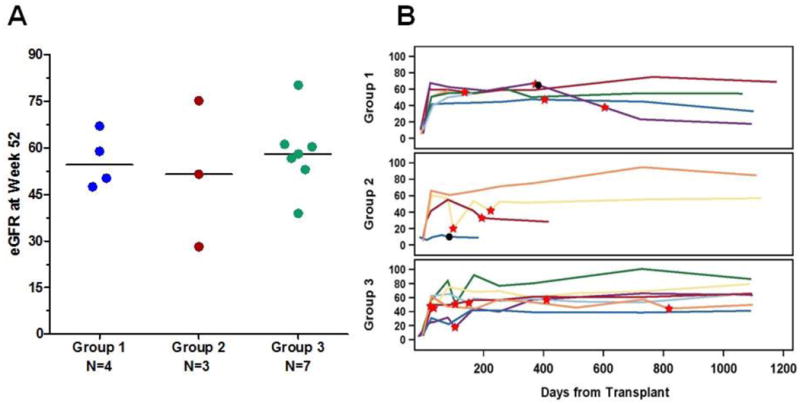
Figure 3.

Renal function in study subjects as measured by estimated glomerular filtration rate (eGFR). (A) eGFR is shown for each subject in the group, at 52 weeks after transplantation. (B) eGFR depicted in each subject through the course of the study with a median follow-up of 1,099 days. The red stars indicate borderline or higher T-cell mediated rejection. Black dots indicate graft loss. Two subjects in group 2 who experienced graft loss within the first 2 weeks post-transplant did not have any GFR data available for inclusion in the figure.
