
Figure 8. Sub-cellular localization of DCLK1-S isoform in COLO205-S-GFP clones, stained with GFP antibody.
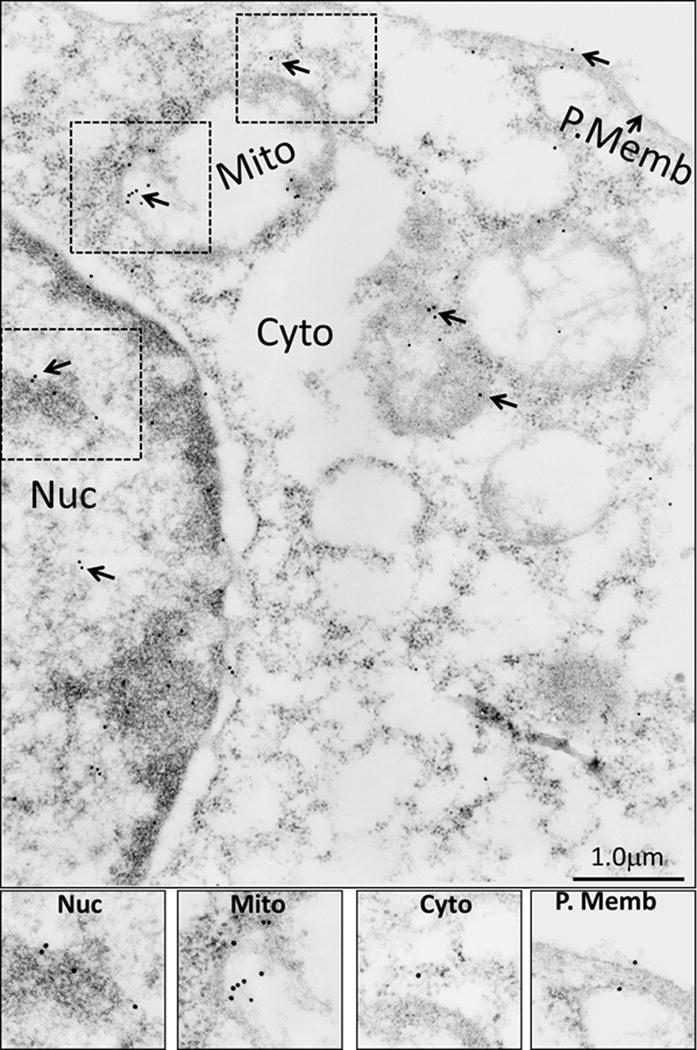
The COLO205-S-GFP clones were processed for IEM analysis with GFP-Ab as described in the legend of Figure 6, and the insets demonstrating the presence of DCLK1-S in the different sub-cellular fractions is enhanced and presented at the bottom of the figure. The relative distribution of DCLK1-S isoform was quantified as described in the legend of Figure 5b, and is presented as bar graphs in Figures 5b and c.