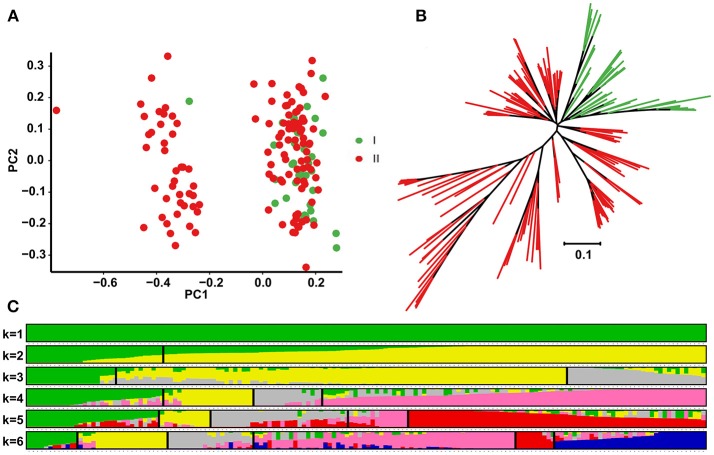
Figure 2.
Principal component analysis (PCA), phylogenetic tree construction and population structure analysis of the 158 peanut accessions. (A) Scatter plots of the first two principal components. The horizontal and vertical coordinates represent PC1 (with variance explain 8.16%) and PC2 (with variance explain 5.23%). Each dot represents an accession. (B) Phylogenetic tree constructed with 17,338 high quality SNPs. (C) Population structure dividing the accessions into two groups (ΔK value was 0.47): subsp. hypogaea (group I) and subsp. fastigiata (group II).

