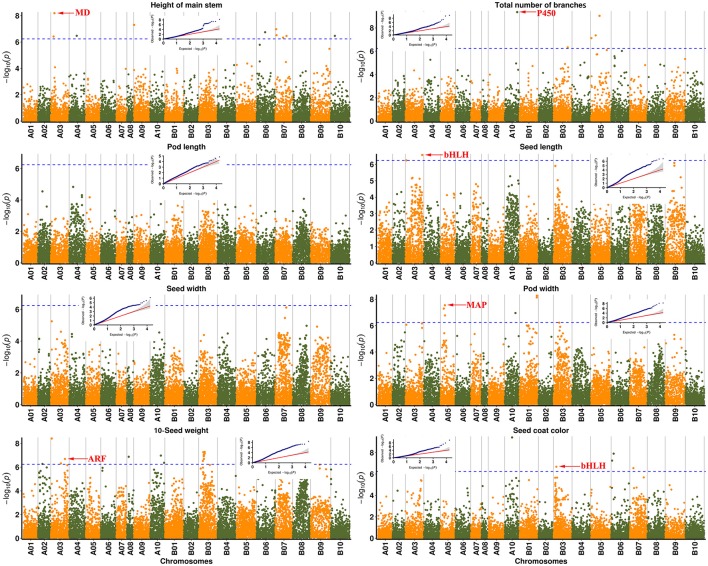
Figure 3.
Genome-wide association studies (GWAS) of traits associated with peanut domestication. Manhattan plots with corresponding small QQ plots are shown in each figure of each trait. Associated significant SNPs are marked by arrows with reported candidate genes. The Bonferroni multiple test threshold is shown by a dotted blue line. MD: Malate dehydrogenase; P450: Cytochrome P450 superfamily protein; bHLH: bHLH transcription factor; ARF: Auxin response factor; MAP: Microtubule-associated protein.

