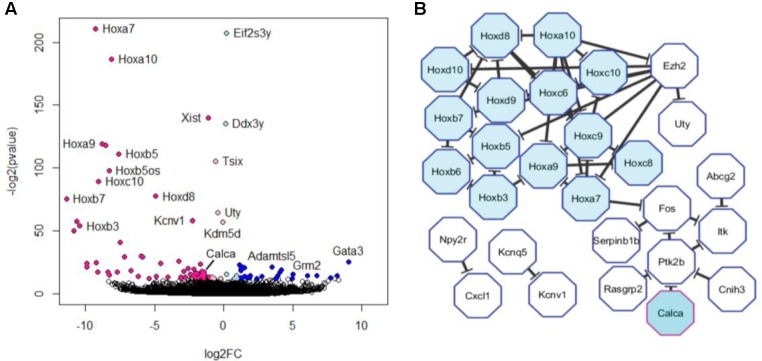
FIGURE 3.
Differential expression of trigeminal versus dorsal root ganglion transcripts. (A) Volcano plot of differentially expressed genes obtained using Deseq2. Colored dots represent genes that were significantly dysregulated at FDR < 0.05. Genes upregulated in trigeminal ganglion are depicted in light (log2FC > 0) and dark blue (log2FC > 1). Genes upregulated in dorsal root ganglion are depicted in light (log2FC < 0) and dark pink (log2FC < –1). Note that this graph includes genes which are not expressed according to our cut-off as well as those which are enriched in satellite glial cells (see Supplementary Table 1). (B) The 44 unambiguously neuronal genes that were found to be upregulated in dorsal root ganglion at FDR < 0.05 were fed into a protein–protein interaction analysis. The resulting network is depicted here and includes 28 genes, 50% of which were Hox genes.

