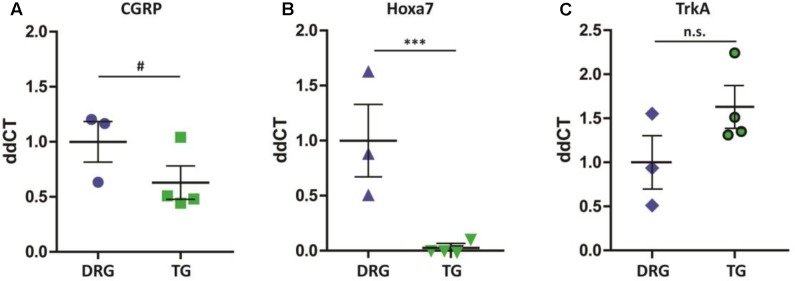
FIGURE 5.
qPCR validation of differentially expressed genes. (A) Similarly to the RNA-seq dataset, CGRP mRNA (Calca) was higher in the DRG when compared to TG (#p = 0.056). (B) Hoxa7 gene is exclusively expressed in DRG neurons (∗∗∗p < 0.001), (C) whereas TrkA (Ntrk1) is equally expressed across the two groups of neurons (p > 0.05). Results shown are from samples extracted from a separate cohort of mice: n = 3 DRG and n = 4 TG. Plotted here are individual ddCT values normalized to GAPDH, including means and standard errors of the means; p-values were obtained using a Mann–Whitney test.

