
FIGURE 6.
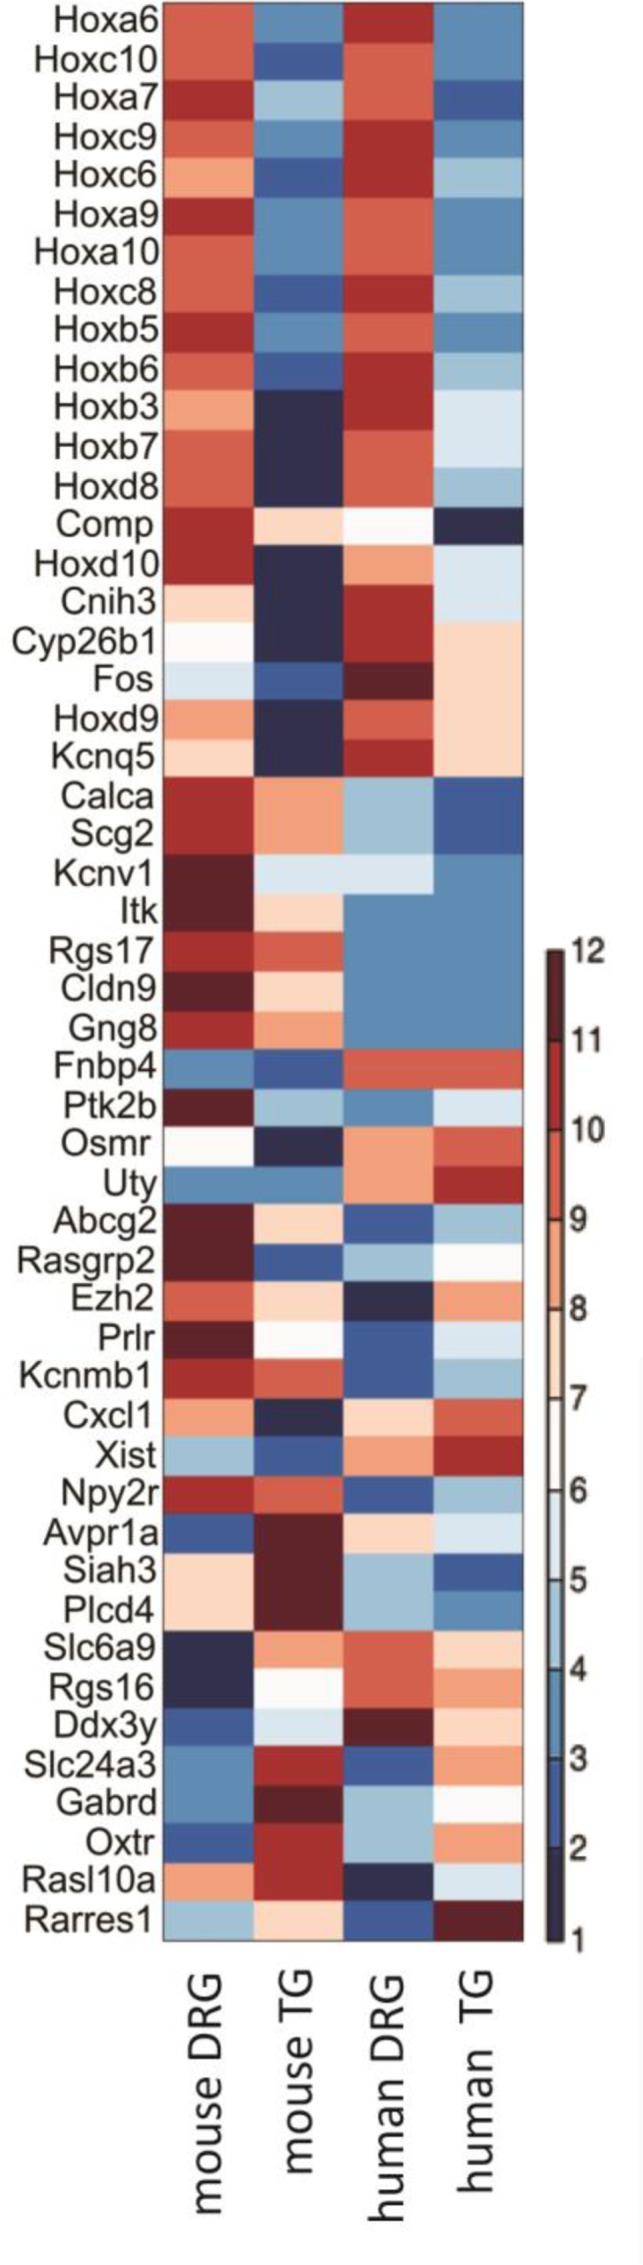
Interspecies comparison of differentially expressed neuronal transcripts in mouse and whole ganglion transcripts in human. Of the 63 genes found to be differentially expressed in DRG and TG, 50 could also be easily identified in a dataset examining expression in human (Flegel et al., 2015). Depicted here is a standardized heatmap of the average log2 (FPKM) values from the two different datasets. Blue indicates negative values, i.e., FPKM < 1, with the genes likely lowly expressed or absent. Increasing levels of expression are represented by increasing degrees of red. See Supplementary Table 3 for the underlying raw FPKM values.