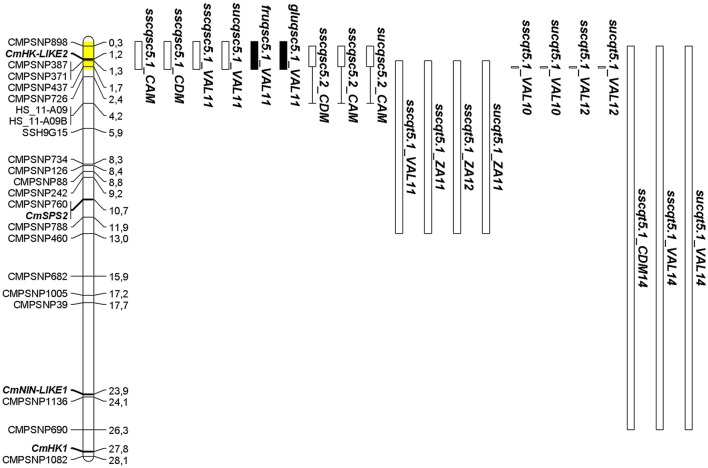
Figure 1.
Positions of QTL detected in SC5-1 and SC5-2 within a 1.88 Mb interval on chromosome 5 (shaded in yellow) colocating with those detected in TRI-derived lines to a portion of the same interval. Locations of SNPs and sucrose metabolism genes (bold italics) are given in megabases (Mb). QTL nomenclature for traits is given as in Tables 2, 3. QTL intervals defined by black and white bars represent an increase or decrease in the trait value, respectively. The length of the bar represents the physical size of the SC introgression while areas of heterozygosity are indicated by bracketed line. For the TRI-derived F2 (VAL11, ZA11, ZA12) and BC (VAL10, VAL12) lines, length of bar represents the 1-LOD QTL confidence interval or SNP position showing the most significant linkage, respectively. For TRI5-1, length of QTL bars for sscqt5.1_CDM14, sscqt5.1_VAL14, and sucqt5.1_VAL14 represents the physical size of the TRI introgression.

