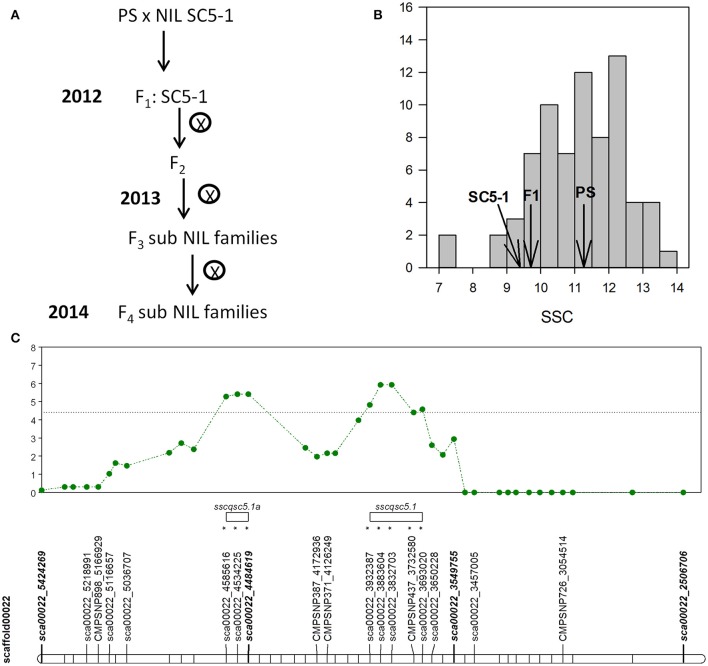
Figure 2.
(A) Breeding scheme used in the SC subNIL development (B) SSC values of melon fruits of the F2 SC subNIL population, parental lines, and F1 hybrid harvested at 55 DAP. (C) Shows single marker QTL analysis of F2 population with likelihood ratio (LR) test statistic profile and significance threshold (dotted line) for SSC with SNPs on scaffold CM3.5.1_scaffold00022 (horizontal bar) on chromosome 5. Markers with (*) show significant linkage to the QTL at the p < 0.05 level. QTL intervals are denoted by open bars.

