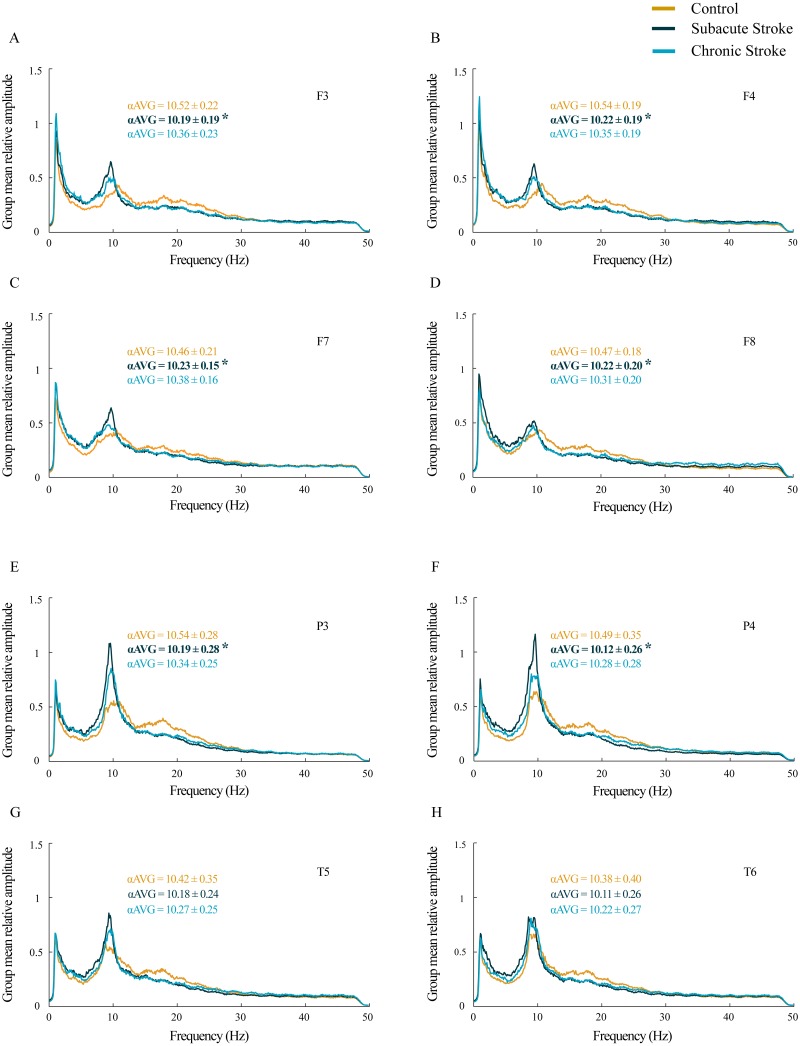
Figure 1. Alterations in alpha frequency following a minor stroke.
Group mean relative amplitude spectra of the frontal (A–D), parietal and temporal (E–H) EEG channels in the subacute (n = 10) and chronic (n = 9) stages of stroke patients vs. healthy controls (n = 11). We have demonstrated statistically significant slower alpha (αAVG) at F3, F4, F7, F8, P3 and P4 in the subacute stroke patients vs. the controls (p ≤ 0.03). In the chronic stage, all stroke induced alpha frequency changes returned to the control values (p ≥ 0.06). Bold numbers and asterisks indicate a statistically significant decrease in αAVG following a stroke.

