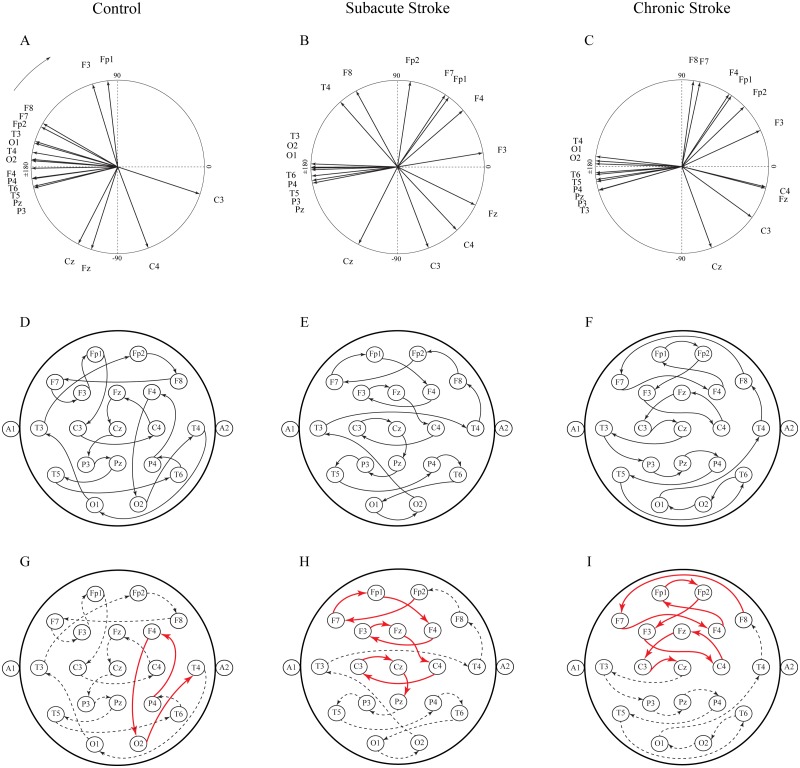
Figure 6. Topographic pattern of “alpha flow” following a minor stroke.
A reconstruction of “alpha flow” in healthy controls (n = 11), the subacute (n = 10) and the chronic (n = 9) stages of stroke patients, based on the group mean alpha PPs distribution in the unit circle (A–C). The topography of the descending order of PPs is plotted by arrows connecting the channel with a higher PP to the channel with the next lower PP (D–F). The greatest alterations in stroke patients vs. the controls were expressed as a permanently established inter-hemispheric “alpha flow” (G–I).

