
Figure 3.
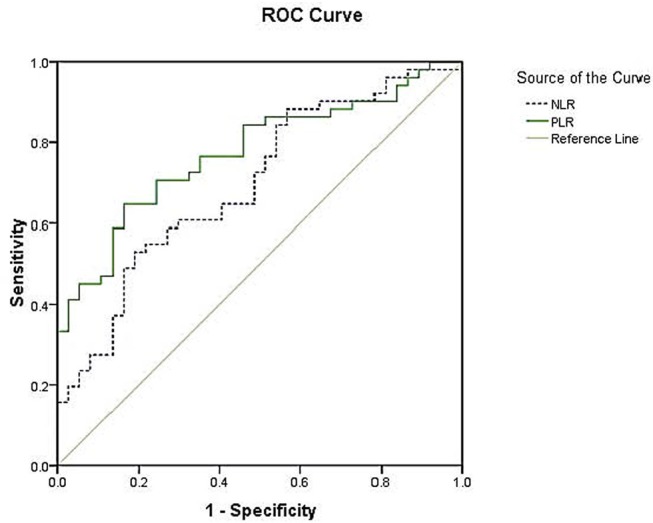
Receiver-operating characteristic (ROC) curves for the platelet-to-lymphocyte ratio (PLR) and neutrophil-to-lymphocyte ratio (NLR) (C-reactive protein as the standard). For PLR, the area under the curve was 0.775, with 64.7% sensitivity and 83.8% specificity. For NLR, the area under the curve was 0.698, with sensitivity and specificity of 52.9% and 81.1%, respectively.