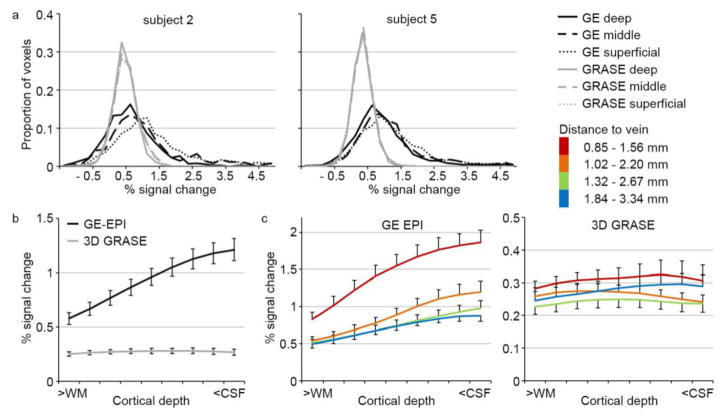
Figure 2. Cortical depth-dependent percent signal change.
(a) Cortical depth-dependent percent signal change (PSC) for subject 2 (left) and subject 5 (right) in the GE-EPI and 3D GRASE dataset (in black and gray, respectively). (b) Average PSC across 9 hemispheres, separate for GE-EPI and 3D GRASE in black and gray, respectively. Error bars indicate the standard error across hemispheres. (c) Average PSC across 9 hemispheres for GE-EPI (left) and 3D GRASE (right), separate for gridpoints with varying distance to a vein. Error bars indicate the standard error across hemispheres. The legend provides the distance to veins (in mm) in superficial and deep cortical depths for each group. WM = white matter; CSF = cerebrospinal fluid.

