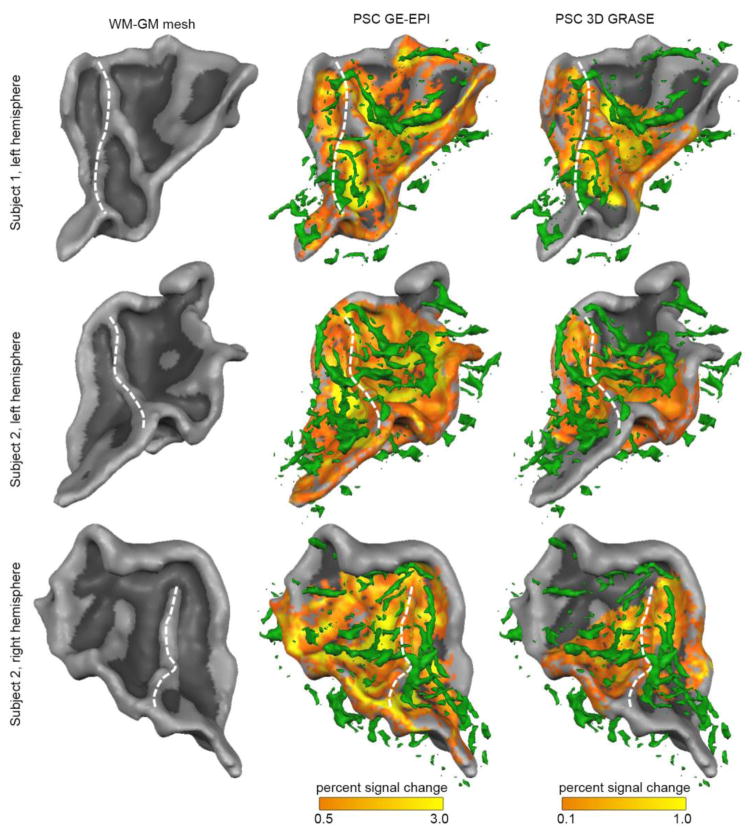
Figure 4. Overlay of percent signal change and vein proximity.
The overlay between the T2*-based vein segmentation (green; second and third column) and the percent signal change (PSC) in response to the natural sounds is shown for three hemispheres. The second and third column show PSC in the GE-EPI and 3D GRASE dataset, respectively. The white dotted line indicated the location of HG.

