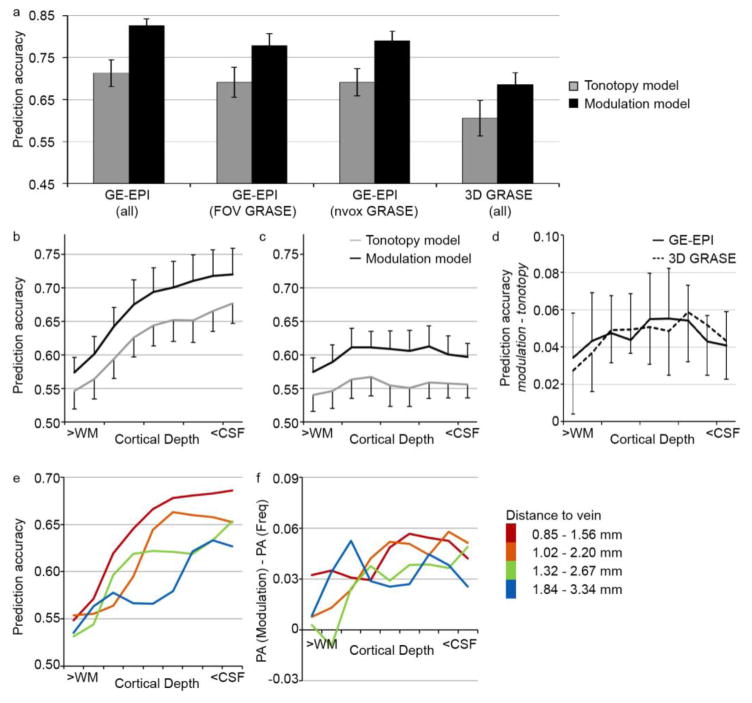
Figure 5. Performance of computational models.
(a) Model performance, expressed as prediction accuracy, on the GE-EPI dataset (bilateral auditory cortex), on the GE-EPI dataset including only the FOV for which 3D GRASE data was collected, on the GE-EPI dataset while including the same number of voxels as included in the 3D GRASE data, and on the 3D GRASE dataset. Voxels are included that responded significantly to the natural sounds (p < 0.05 uncorrected, selected per dataset). Error bars indicate the standard error across subjects. (b–d) Cortical depth-dependent model performance for the tonotopy and modulation model in the GE-EPI (b) and 3D GRASE (c) dataset, and the difference in prediction accuracy between the two encoding models (d). Error bars indicate the standard error across hemispheres. (e–f) Performance of the modulation model (left) and the experimental effect (difference in performance between the computational models; right), separate for gridpoints with varying distance to a vein. The legend provides the distance to veins (in mm) in superficial and deep cortical depths for each group.

