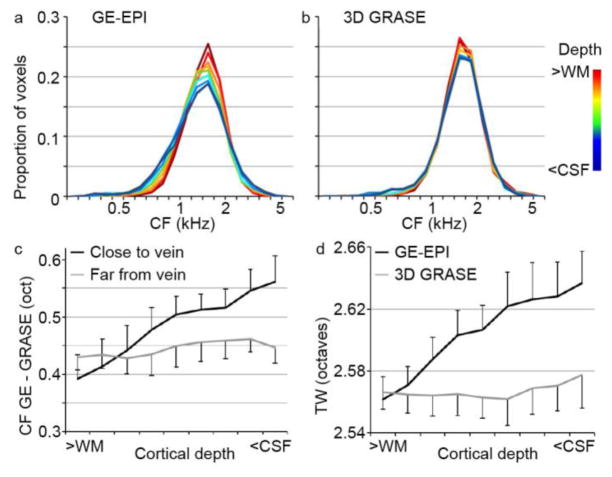
Figure 7. Cortical depth-dependent bias in voxel frequency preferences.
(a–b) Histograms of frequency preference (BF) across cortical depths, in the GE-EPI and 3D GRASE dataset respectively. For GE-EPI only (a), a widening of preferred frequencies can be observed in cortical depths closer to the CSF. (c) The gridpoint-wise difference (in octaves) in frequency preference between the GE-EPI and 3D GRASE dataset was significantly larger in gridpoints close to veins than in gridpoints far from veins. This effect emerged in cortical depths closer to the CSF. In (c–d), error bars indicate the standard error across hemispheres. (d) Cortical depth-dependent tuning width increased (i.e., frequency selectivity decreased) in cortical depths closer to the CSF for GE-EPI but not for 3D GRASE.

