
Figure 7. DHA treatment reduces TBI-mediated cortical and hippocampal damage.
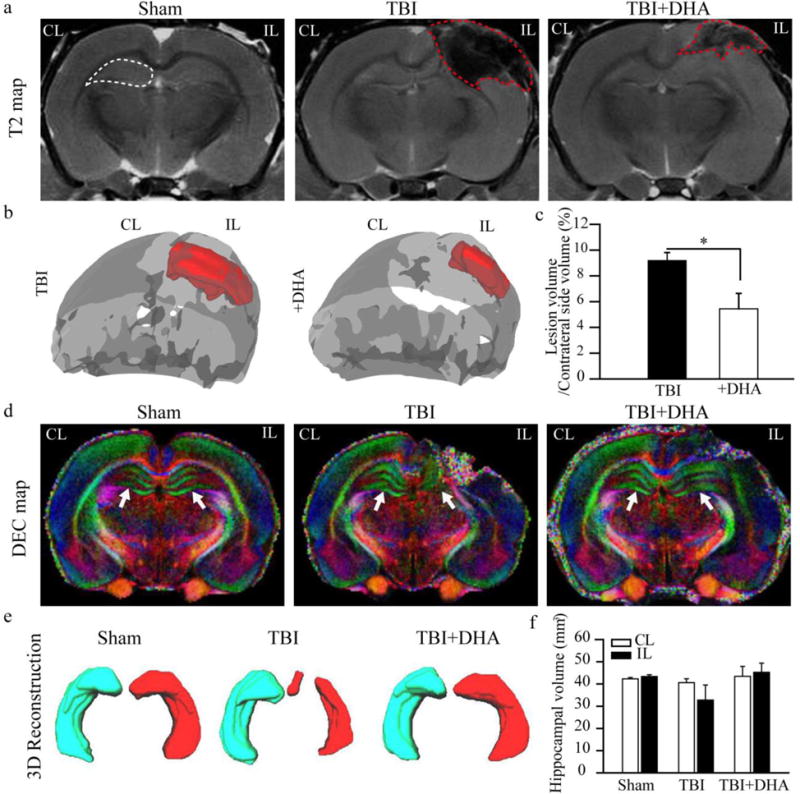
(a) Representative T2-weighted images maps of ex vivo brains. The ROIs show the hippocampus (white dash line) and lesioned areas (red dash line).
(b) 3D surface renderings of the lesioned areas (red) of TBI + Vehicle and TBI+DHA brains.
(c) Lesion volume. Values are mean ± S.E. (n=4). *p < 0.05.
(d) Representative DEC maps of ex vivo brains. The color of the DEC maps represents the diffusion direction of the white matter fibers in which red is left-right, green is dorsalventral, and blue is head-foot. Arrow: hippocampus
(e) 3D reconstructions of the CL and IL hippocampi of Sham, TBI + Vehicle-treated and TBI + DHA-treated rats.
(f) Hippocampal volume. Values are mean ± S.E. (n=4).