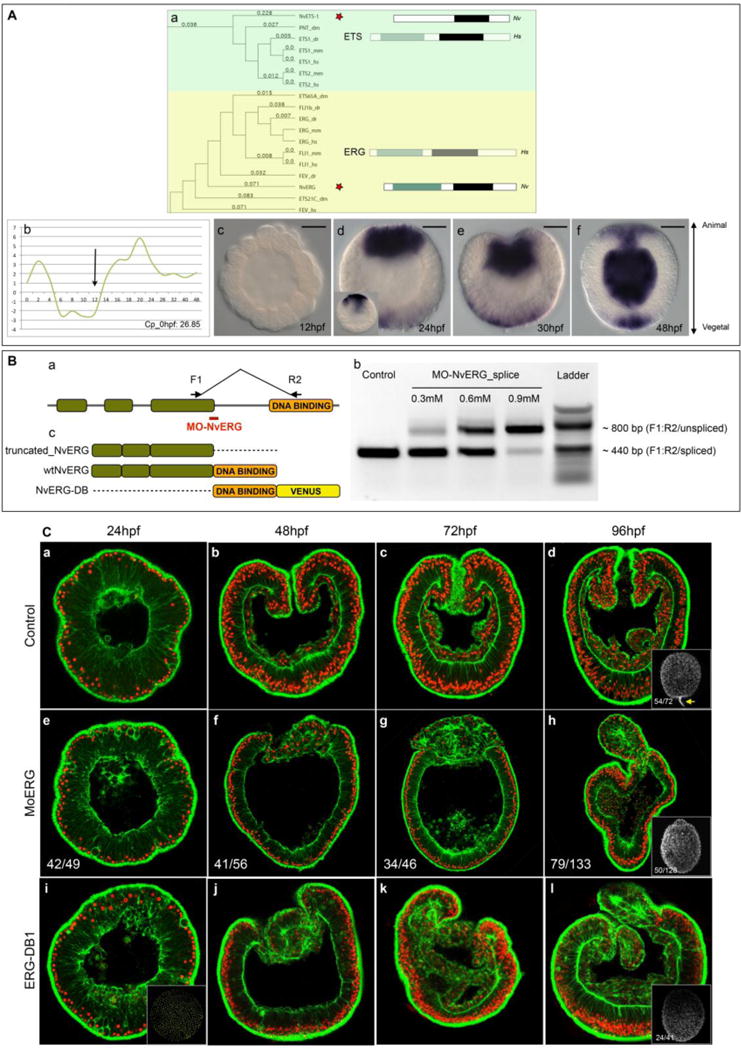
Figure 1. NvErg is required for endomesoderm formation, gastrulation and participates in apical tuft development.

(A) Identification of NvErg and analysis of its spatiotemporal expression. (Aa) Excerpt of the phylogenetic analysis of the ETS transcription factor complement in Nematostella, indicating the existence of NvERG and NvETS1 orthologs in cnidarians. The full analysis can be found in Fig. S1. To the right of the tree, the bars indicated the protein domain organization of either the human representative (Hs, greyed out rectangles) of the subfamily as well as the protein domain organization of the Nematostella ortholog (Nv). Green rectangles indicate the Pointed domain, black rectangles the ETS domain. (Ab) Temporal expression of Nverg analyzed by qPCR during embryonic development of the first 48 hours post fertilization. The y-axis indicates relative fold changes compared to fertilized eggs. (Ac–Af) Spatial (in situ hybridization) expression of Nverg at early (Ac) and late (Ad) blastula, mid (Ae) and late (Af) gastrula stages. Orientation of blastula stages was determined by the thickening of the animal pole prior to its invagination that was observable in certain embryos of a given batch at the analyzed time point. Animal pole to the top and vegetal pole to the bottom. The black bar in the upper right corner of Ac–Af indicates the scale bars: 50μm (Ba) Schematic representation of the genomic organization of NvERG, and the recognition site of MO-NvERG and the position of the PCR primers to verify the efficiency of the splice blocking morpholino. (Bb) Splice blocking efficiency of MO-NvERG analyzed by RT-PCR at increasing concentrations of MO-NvERG injected embryos. (Bc) Schematic representation of the protein structure of the various tools used in Fig. 1C and Fig. S2. (C) Morphological effects of inhibiting NvERG function during early Nematostella development. (Ca–Cd) Control embryos injected with MO-CTRL, (Ce–Ch) embryos injected with MO-NvERG or (Ci–Cl) mRNA encoding a dominant negative version of NvERG (NvERG-DB1) at 24 (Ca,Ce,Ci, late blastula), 48 (Cb,Cf,Cj, late gastrula), 72 (Cc,Cg,Ck, early planula) and 96 (Cd,Ch,Cl, late planula) hpf. All images are lateral views with the animal/oral pole to the top and confocal z-sections using phalloidin (green) to show f-actin filaments and propidium iodide (red) to visualize the nuclei. The insets in (Cd, Ch, Ci) correspond to lateral views of embryos stained with acetylated tubulin to visualize the presence or absence of the apical tuft (yellow arrow in Cd). The numbers in the insets indicate the number or embryos with the represented phenotype/total amount of analyzed animals.
