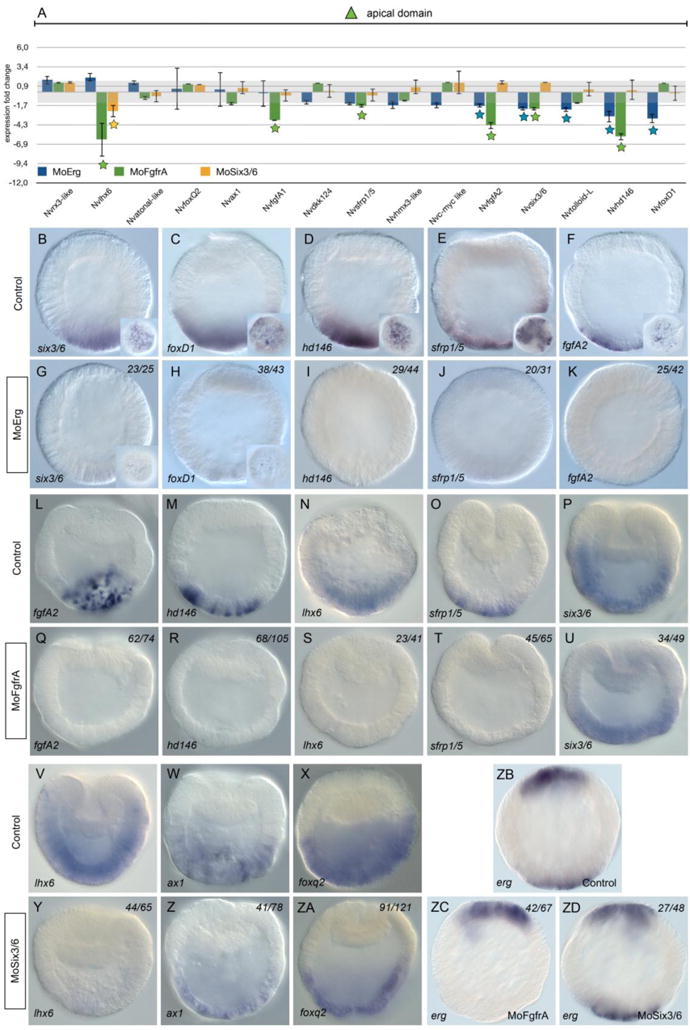
Figure 6. Molecular phenotype analysis of MO-NvERG, MO-NvFGFRA and NvSix3/6 injected embryos on genes expressed in the apical domain.

(A) Changes in gene expression of 15 potential components of the cnidarian apical domain GRN within the vegetal hemisphere after NvERG (blue), NvFGFRA (green) or NvSix3/6 (yellow) knock-downs compared to control embryos analyzed by qPCR. Changes in gene expression are indicated as relative fold changes compared to MO-CTRL injected control embryos (x ± sem, n = 3 per gene). The grey bar indicates no significant change in gene expression (−1.5,1.5). Stars below the bars indicate significant variation. Analysis of the molecular effects of NvERG (G–K), NvFGFRA (Q–U) and NvSix3/6 (Y–ZA) inhibition compared to control injections (B–F, L–P, V–X) on apical domain gene expression analyzed by in situ hybridization. Antisense probes used as indicated in the bottom left corner of each image (also valid for the corresponding inset). The numbers in the upper right corner indicates the ratio of embryos with perturbed gene expression to the total number of analyzed embryos. All images are lateral views with the presumptive endomesoderm (animal pole) to the top.
