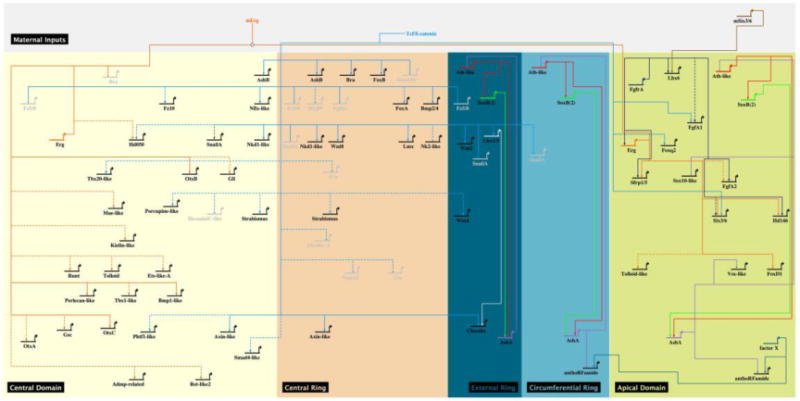
Figure 7. Updated gene regulatory network orchestrating embryonic development in the cnidarian N. vectensis.

Enhanced Biotapestry diagram [86] of the gene regulatory network describing the gene deployment at 24hpf and regulatory interactions of endomesodermal, ectodermal and neuronal genes identified in previous studies [24,31,35,39,74]. No assumption on whether these interactions are direct or indirect is made. Solid lines indicate functional evidence obtained by qPCR as well as in situ hybridization, dashed lines indicate evidence obtained only by qPCR. The colored boxes represent the spatial domains as described in Figure 4A. Genes inactivated by repression in a given territory are represented in light grey. Controversial results [24,76] about the role of cWnt/TCF signaling on NvsnailA expression is indicated by a red dashed arrow. The same GRN, including non-connected genes that are expressed within the specific territories is provided in Figure S5. A first draft of the global GRN framework for body wall endomesoderm, pharynx (endomesoderm and ectoderm), mouth, body wall ectoderm, sub-apical and apical domain including components of the Nematostella nervous system at the end of gastrulation (48 hpf) is provided in Figure S6.
