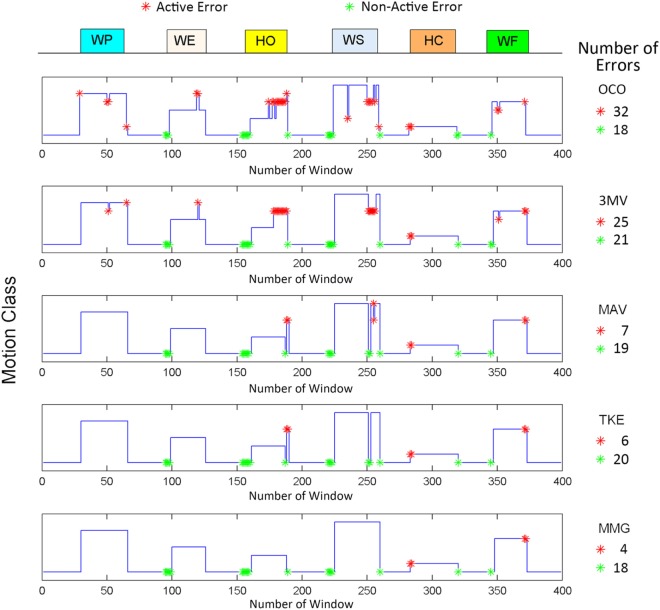
Figure 5.
A sample result of the online test for five different schemes. In each plot, the horizontal axis represents the number of window while the vertical axis shows the actual motion class performed by the subject, in the same way as shown in Figure 4. The arrow on the top with bars of different colors shows the designated motion classes. The red and green asterisks represent the active and the non-active errors, respectively, with corresponding error numbers in the whole output sequences.

