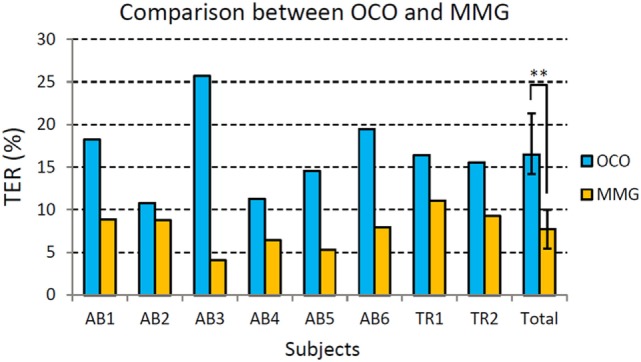
Figure 7.

Comparison of total error rate (TER) for each individual subject between original classification output (OCO, in gray) and the motion output with mechanomyogram (MMG) thresholding (in blue). AB stands for the able-bodied subjects, and TR represents the transradial amputees. Error bars stand for standard deviations. (**In average, the TER of MMG is significantly lower than that of OCO, p < 0.01.)
