
Figure 4.
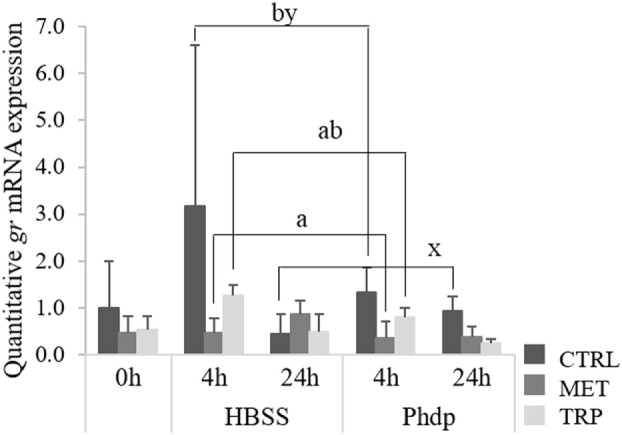
Quantitative gr mRNA expression in blood of juvenile European seabass fed CTRL ( ), MET (
 ), or TRP (
 ) for 14 days (0 h) and sampled at 4 or 24 h post Hank’s Balanced Salt Solution (HBSS) or Phdp i.p. injection (mean ± SD, n = 6). x and y stand for significant differences attributed to sampling time. a and b stand for significant differences attributed to dietary treatments. One-way analysis of variance (ANOVA) (before i.p. injection) and multifactorial ANOVA (after i.p. injection); Tukey post hoc test; p ≤ 0.05.