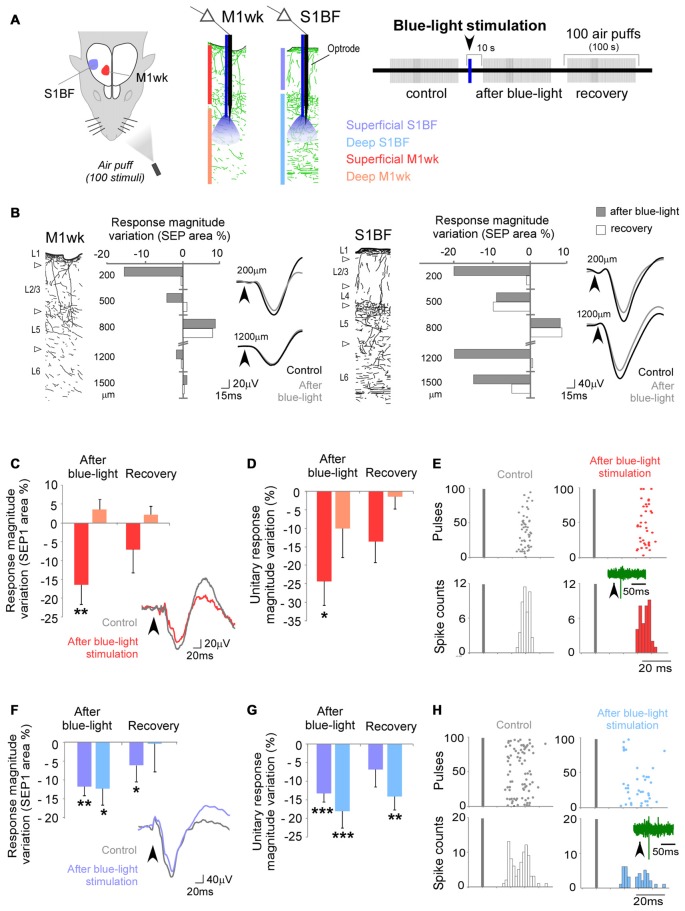
Figure 6.
Effects of selective optogenetic stimulation of Po terminal axons in particular layers of M1wk and S1BF cortices. (A) Diagram of the experimental protocol. A single pulse of blue-light (473 nm, 300 ms, <30 mW/mm2) was applied thought an optrode in the cortex to activate Po axonal terminals expressing ChR2 + eYFP. This blue-light pulse was applied immediately after the “control train” of whisker stimuli. SEPs and unit responses were recorded in the superficial and deep layers (shaded in different color hues, respectively) of S1BF (blue) and M1wk (red) cortices. (B) A representative case of these experiments displaying a different laminar innervation pattern and Po effects on tactile responses in M1wk and S1BF cortices. Cortical columns with immunolabeled Po axons are drawn for each area. Changes in SEP1 area immediately after blue-light application (gray) and during the recovery train (second train after Po stimulation; white) are represented as the variation of percentage to the control values in different cortical depths. Negative values symbolize inhibition and positive values facilitation. Representative trace examples of SEPs recorded during control (black line) and after blue-light (gray dashed line) pulses are shown on the right. (C) Blue-light activation of Po axons modulates SEP1 in M1wk. Mean values of changes in SEP1 curves area are represented as the variation of percentage to the control values. Examples of SEPs during the control (gray line) and after blue-light application (red line) are shown on the right. Grey bar indicates whisker stimuli application. (D) Mean values of changes in unit responses are represented as the variation of spike counts percentage to the control train. (E) Examples of PSTH and raster plots during the control (white) and after blue-light application (red) in superficial layers are shown. Representative spike traces are shown inside PSTH. Bars indicate whisker stimuli. (F) Blue-light activation of Po axons also modulates SEP1 in S1BF. Conventions as in panel (C), except the example of SEPs after blue-light application is shown as blue line. (G) Unit whisker responses in S1BF. Conventions as in panel (D). (H) Examples of PSTHs and raster plot of S1BF responses. Conventions as in panel (E), except that both represent example of deep layers, and the PSTH and raster plot following blue-light application are represented in blue.

