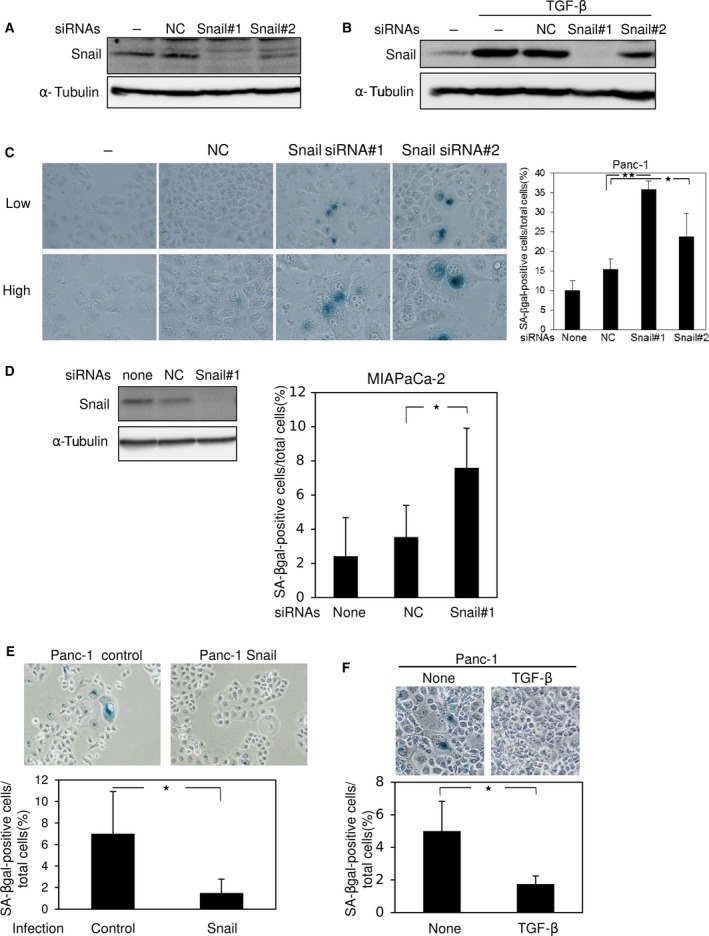
Figure 1.

Cellular senescence by Snail knockdown in pancreatic cancer cells. (A and B) Forty‐eight hours after transfection of control siRNA (NC) or two kinds of siRNAs against human Snail (#1 and #2) into Panc‐1 cells, the level of Snail protein was examined by immunoblotting. Cells were treated with 1 ng·mL−1 of TGF‐β for 3 h (B). α‐Tubulin levels were monitored as a loading control. Results are representative of at least three experiments. (C) Three days after transfection with control siRNA (NC) or Snail siRNAs (#1 and #2), Panc‐1 cells were analyzed by SA‐β‐gal staining, and photographs were taken (left panel) to count the number of SA‐β‐gal‐positive cells (right panel). Low, low magnification (×100). High, high magnification (×200). *P < 0.05, **P < 0.01, ANOVA test. (D) Forty‐eight hours after transfection of control siRNA (NC) or Snail siRNA (#1) into MIAPaCa‐2 cells, the level of Snail protein was examined by immunoblotting. α‐Tubulin levels were monitored as a loading control (left panel). Three days after transfection with control siRNA (NC) or Snail siRNAs (#1), MIAPaCa‐2 cells were analyzed by SA‐β‐gal staining, and photographs were taken to count the number of SA‐β‐gal‐positive cells (right panel). *P < 0.05, ANOVA test. (E) Panc‐1 cells infected with control or Snail lentiviruses were cultured for 7 days and then subjected to SA‐β‐gal staining; photographs were taken (upper panel) to count the number of SA‐β‐gal‐positive cells (lower panel). *P < 0.05, ANOVA test. (F) Panc‐1 cells treated with 1 ng·mL−1 of TGF‐β for 7 days were subjected to SA‐β‐gal staining; photographs were taken (upper panel) to count the number of SA‐β‐gal‐positive cells (lower panel). Each value in (C–F) represents the mean ± SD of triplicate determinations from a representative experiment. Similar results were obtained at least three independent experiments. *P < 0.05, ANOVA test.
