
Figure 1.
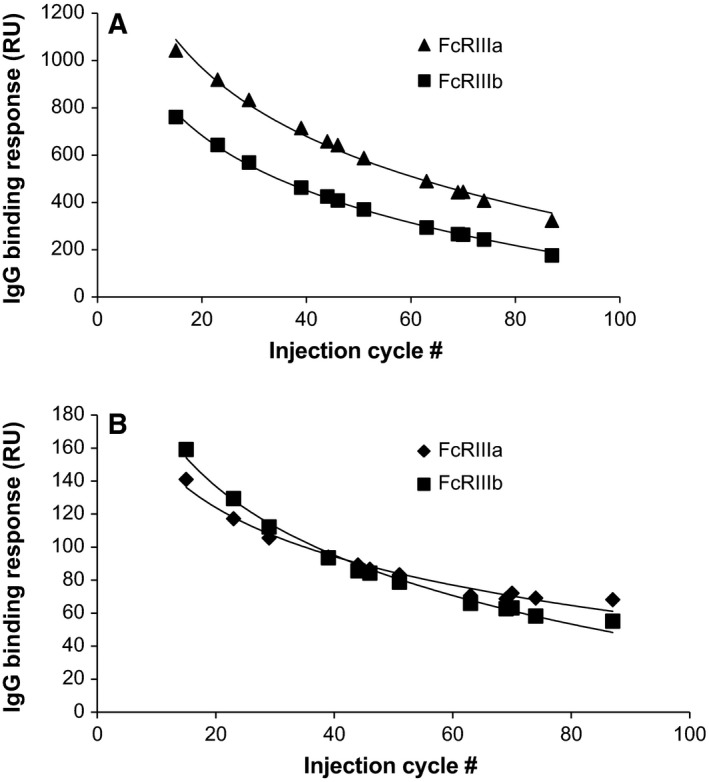
IgG binding response at 500 μg/mL to the four low‐affinity Fcγ receptors (A: FcγRIIIa and FcγRIIIb; B: FcγRIIa and FcγRIIb) during 90 sequential analyses. Each curve followed a logarithmic decay, which was used to correct for decay according to injection cycle number.