
Figure 5.
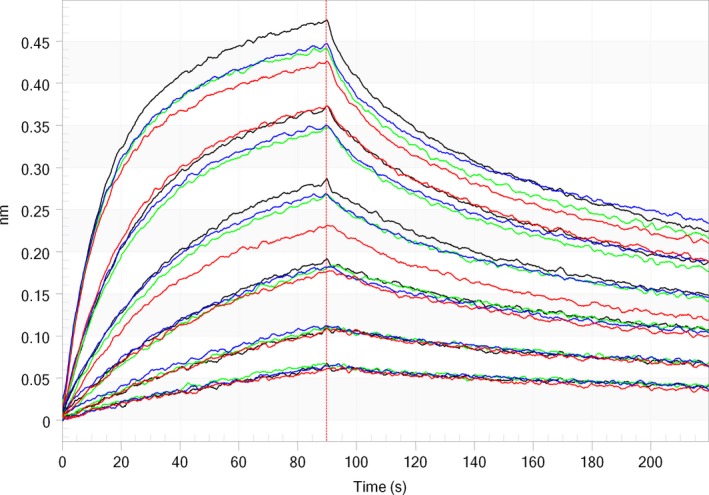
Overlay of sensorgrams of deamidated samples on FcRn binding (reference in black; t = 48 h/pH 8 in green; t = 72 h/pH 8 in red; and t = 96 h/pH 8 in blue). IgG concentrations between 2.5 and 10 nm.
Official websites use .gov
A
.gov website belongs to an official
government organization in the United States.
Secure .gov websites use HTTPS
A lock (
) or https:// means you've safely
connected to the .gov website. Share sensitive
information only on official, secure websites.
Overlay of sensorgrams of deamidated samples on FcRn binding (reference in black; t = 48 h/pH 8 in green; t = 72 h/pH 8 in red; and t = 96 h/pH 8 in blue). IgG concentrations between 2.5 and 10 nm.