Figure 6.

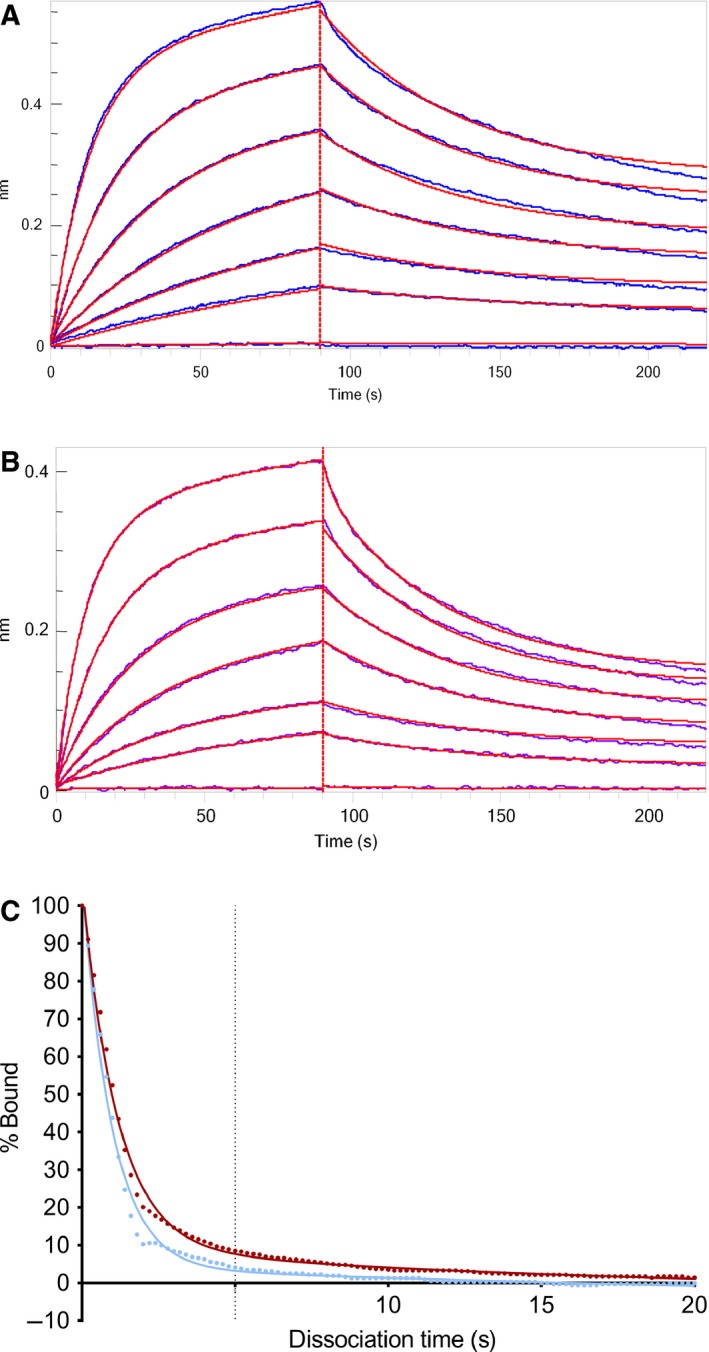
Sensorgrams of IgG1 binding to FcRn of glycosylated (A) and deglycosylated (B) IgG1. Fitted curves are shown in red. (C) The fraction bound at neutral pH of glycosylated (red) and deglycosylated (blue) IgG.

Sensorgrams of IgG1 binding to FcRn of glycosylated (A) and deglycosylated (B) IgG1. Fitted curves are shown in red. (C) The fraction bound at neutral pH of glycosylated (red) and deglycosylated (blue) IgG.