Figure 7.

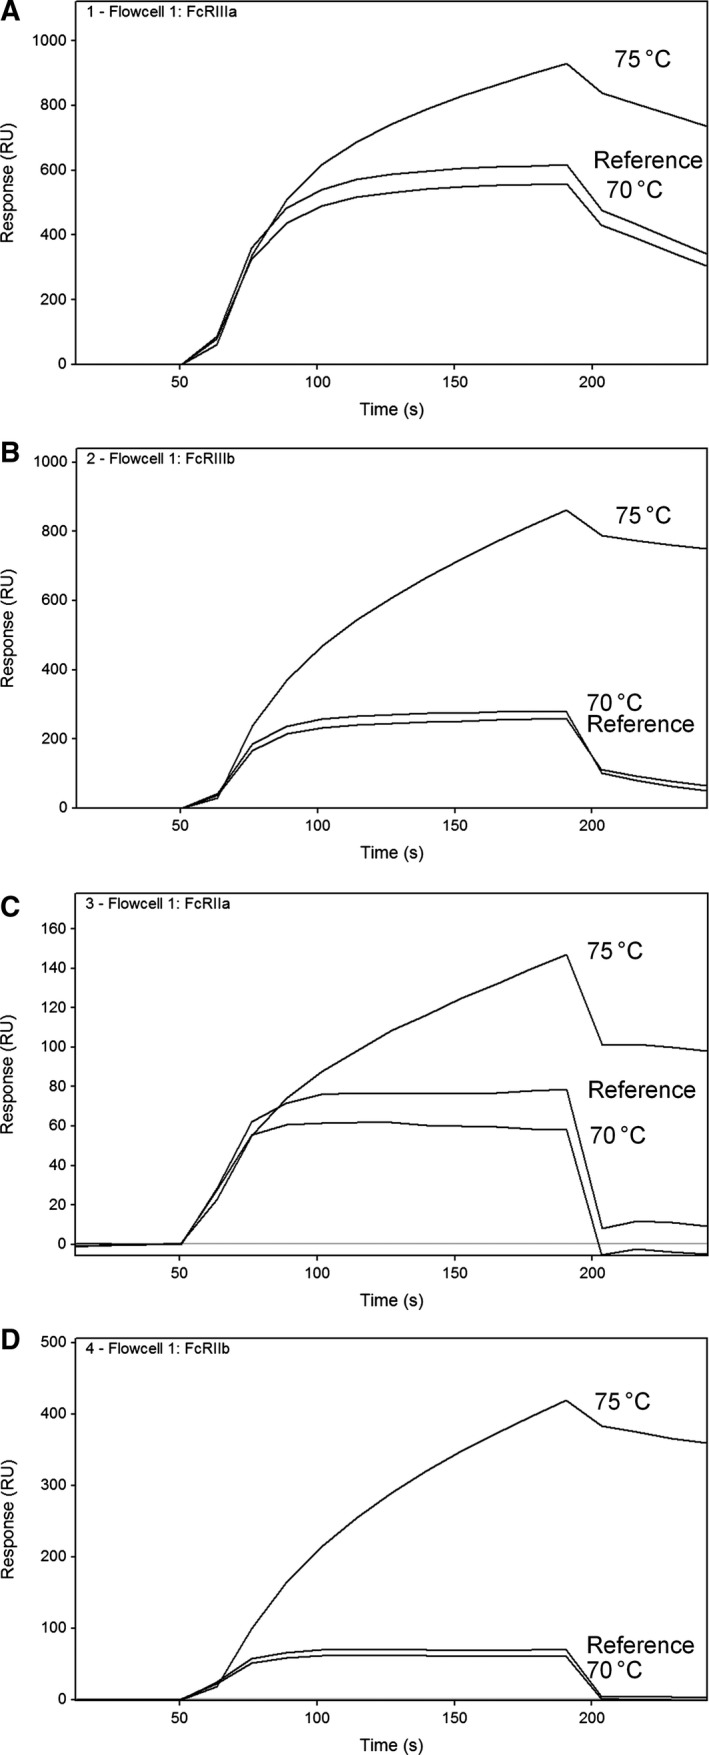
Sensorgrams (measured at 250 μg·mL−1) of reference and aggregated IgG samples heated to 70 and 75 °C for 15 min on FcγRIIIa (A), FcγRIIIb (B), FcγRIIa (C), and FcγRIIb (D), respectively.

Sensorgrams (measured at 250 μg·mL−1) of reference and aggregated IgG samples heated to 70 and 75 °C for 15 min on FcγRIIIa (A), FcγRIIIb (B), FcγRIIa (C), and FcγRIIb (D), respectively.