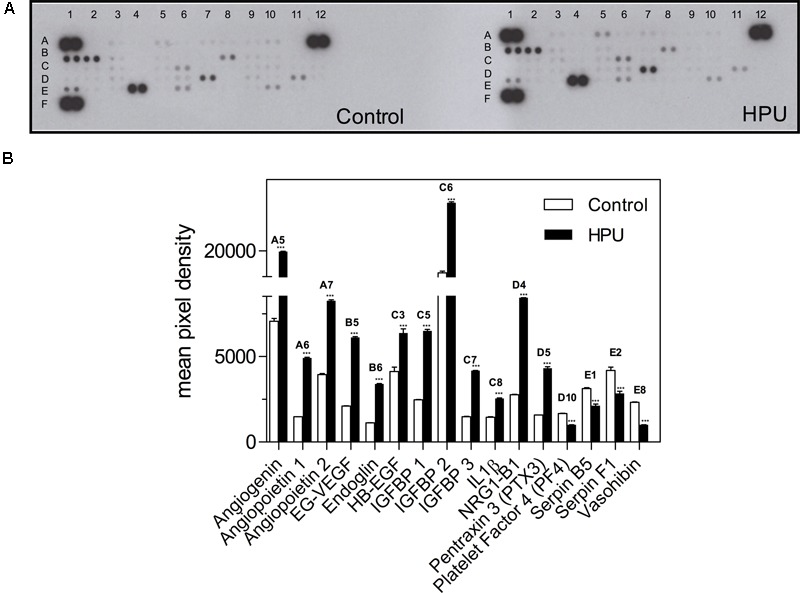
FIGURE 4.

Effect of HPU on the expression levels of angiogenesis-related proteins. (A) Angiogenic array membranes obtained with cellular extracts from AGS cells treated or untreated with 300 nM HPU for 9 h. (B) Profile of angiogenic factors generated from the array membranes. The values in the bar graph represent the mean of pixel density of the two spots of the array ±SEM from one experiment, using pooled cellular extracts from three independent experiments; ∗∗∗p < 0.001 versus control, unpaired two-tailed t-test.
