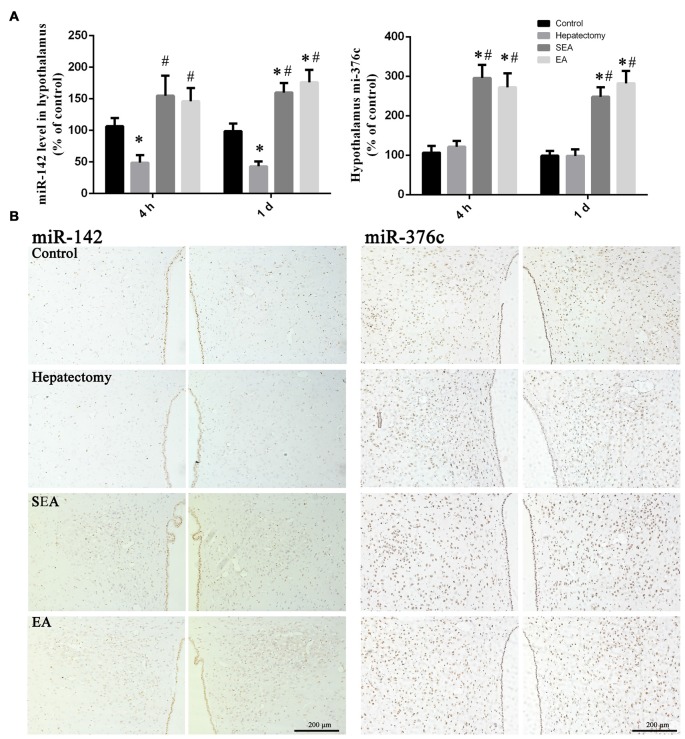
Figure 8.
miR-142 and miR-376c expression in the hypothalamus. Quantification of the expression levels of miR-142 and miR-376c among the control, hepatectomy, SEA and EA groups at 4 h and 1 day after hepatectomy (A). The data are presented as the mean ± SD (n = 7) *vs. control group (p < 0.05); #vs. hepatectomy group (p < 0.05). Detection of miR-142 and miR-376c in the PVN among groups at 1 day after hepatectomy (B). Scale bar = 200 μm (n = 5).

