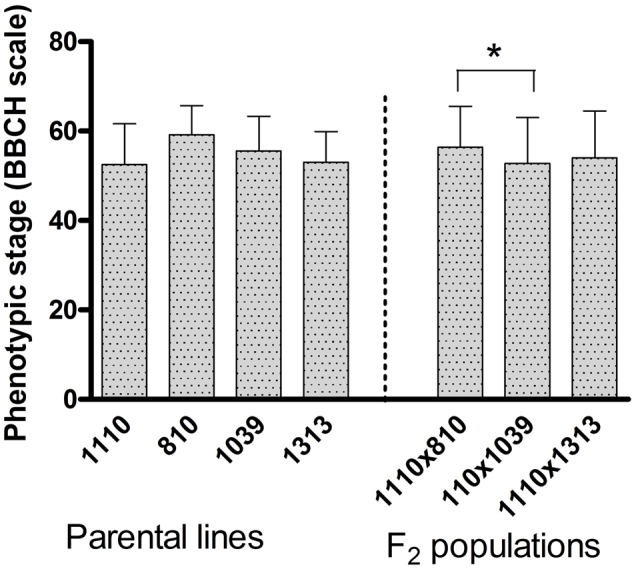
FIGURE 1.

The average phenotypic growth stage according to the BBCH-scale for cereals registered on individual plants before subjecting them to heat stress (day 0). The error bar represents standard deviation (n = 10 for each parental cultivar and n = 140 for each mapping population). Significant difference between the four parental cultivars and three mapping populations is indicated by ∗ at p < 0.05.
